
Fig. S5
- ID
- ZDB-FIG-161018-20
- Publication
- D'Orazi et al., 2016 - Mismatch of Synaptic Patterns between Neurons Produced in Regeneration and during Development of the Vertebrate Retina
- Other Figures
- All Figure Page
- Back to All Figure Page
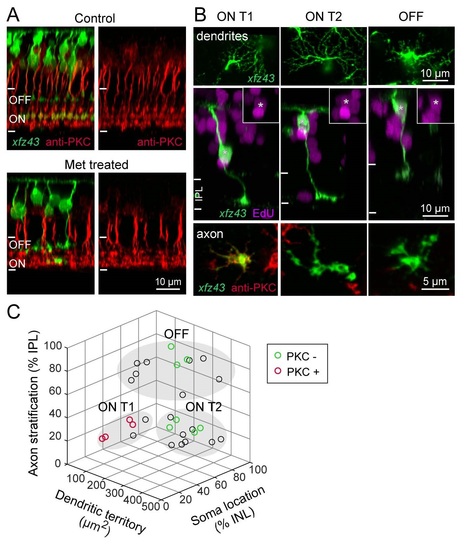
Related to Figure S. Regenerated BCs Recover Characteristic Molecular Expression and Morphology. (A) PKC-positive BCs stratify in ON layers of IPL in the retinas of control and Met-treated xJz43 fish . Orthogonal views from maximum intensity projections of xJz43 BCs together with anti-PKC labeling in 20 dpf control or Met-treated xJz43 larvae. (B) Regenerated xJz43 BCs show type-specific PKC expression . Maximum intensity projections from confocal image stacks of regenerated xJz43 BCs from 20 dpf tissue. Asterisks mark EdU-positive BC nuclei, also shown in insets. EnJace views show dendritic arbors, or axonal arbors together with PKC immunolabeling. (C) Regenerated xJz43 BCs cluster in characteristic groups by morphological measurements. 3D scatter plot of population data for regenerated xJz43 BCs from 20 dpf Met-treated retinas. Each circle represents a single cell, n = 29 cells. Cells that were analyzed for PKC expression are green (PKC-negative) or red (PKC-positive). Filled, gray ovals depict the groups by which cells were classified as ON Tl, ON T2, or OFF types using the K-means clustering algorithm. |