
Fig. 5
- ID
- ZDB-FIG-161018-13
- Publication
- D'Orazi et al., 2016 - Mismatch of Synaptic Patterns between Neurons Produced in Regeneration and during Development of the Vertebrate Retina
- Other Figures
- All Figure Page
- Back to All Figure Page
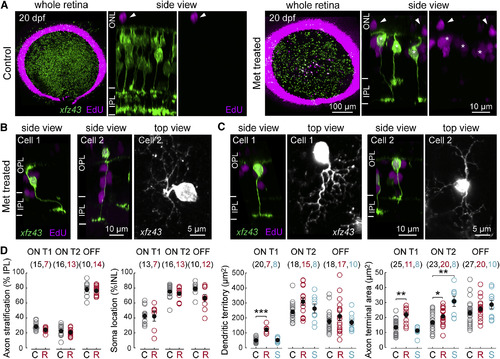
Regenerated xfz43 BCs Resemble Age-Matched BCs from Intact Tissue (A) Maximum-intensity projections of whole-mount retinas from 20 dpf (13 dpa) control and Met-treated xfz43 fish in which mitotic cells were labeled by EdU application from 9 to 12 dpf (2-5 dpa). The dense ring of EdU-positive cells at the peripheral retina demarcates cells generated in the ciliary marginal zone, a region of ongoing proliferation [4]. Asterisks in side views mark xfz43 BCs that incorporated EdU; arrowheads mark EdU-positive cells in the outer nuclear layer (ONL). (B) Examples of regenerated xfz43 BCs with abnormal axon trajectories (cell 1), or mislocalized somata (cell 2). <>(C) Examples of regenerated xfz43 BCs with abnormal dendritic phenotypes; cell 1 has an asymmetric arbor relative to the cell body, cell 2 shows an unusually sparse dendritic arbor. In (B) and (C), side views are orthogonal rotations of the image stack acquired from the whole-mount retina. Top views are the maximum-intensity projections of the cell somata and their dendrites tilted slightly relative to the z axis of the image stack, in order to illustrate the dendritic arbor, the primary dendrite, and the cell body, where possible.(D) Quantification of regenerated (R, red) and survivor (S, cyan) xfz43 BC morphology. Cell types were classified using a combination of at least two morphological features: whether the BC stratified in ON or OFF IPL layers, dendritic territory size, and/or PKC expression. Plots show the population mean compared with control (C, gray) data. Open circles represent individual cells, with the number of cells analyzed shown in parentheses. Error bars, ±SEM. *p < 0.05, **p < 0.01, ***p < 0.001; Wilcoxon-Mann-Whitney rank-sum test. All measurements were made in 20 dpf (13 dpa) larvae. See also Figures S1, S4, and S5. |