
Fig. S4
- ID
- ZDB-FIG-161018-19
- Publication
- D'Orazi et al., 2016 - Mismatch of Synaptic Patterns between Neurons Produced in Regeneration and during Development of the Vertebrate Retina
- Other Figures
- All Figure Page
- Back to All Figure Page
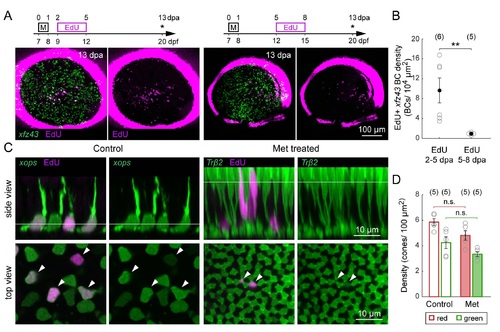
Related to Figure S. Proliferation of Retinal Neurons after Targeted Ablation of BCs. (A) Peak proliferation occurs within 2-5 dpa. Timelines demonstrate the timing of EdU immersion after Met (M) application in two different groups: 2-5 or 5-8 dpa. Asterisks denote age at which larvae were fixed for imaging. Maximum intensity projections of wholemount retinas from 13 dpa Met-treated xJz43 fish that were immersed in EdU. (B) Comparison of the mean density of EdU-positive xJz43 BCs between larvae treated with EdU from 2-5 or 5-8 dpa. ** P < 0.01, Wilcoxon-Mann-Whitney rank sum test. (C) Photoreceptor genesis in the ONL of control and Met-treated xJz43 larvae. (Side view) Orthogonal views of confocal image stacks from control and Met-treated xJz43 animals, with co-labeling for EdU together with rods Tg(xops:GFP) or red cones Tg(Trfβ2:Tomato) . (Top view) En Jace view of the photoreceptors and EdU-labeled nuclei at the levels indicated in the side views. Arrowheads mark EdU-positive nuclei. (D) Quantification of the mean cell density of red or green cones in retinas from Met-treated and age-matched control xJz43 fish crossed with Tg(Trfβ2 :Tomato) and immunostained with anti-arrestin3a. Pair-wise comparisons showed that cone densities did not differ between control and Met-treated retinas (red cone density: P > 0.05, green cone density: P > 0.05 , Wilcoxon-Mann-Whitney rank sum test) . Each open circle represents a single retina, with the number of retinas analyzed shown in parentheses. Error bars are ± SEM. All measurements were made in 20 dpf (13 dpa) xJz43 larvae. |