
Fig. 6
- ID
- ZDB-FIG-160819-24
- Publication
- Halloum et al., 2016 - Deletion of a dehydratase important for intracellular growth and cording renders rough Mycobacterium abscessus avirulent
- Other Figures
- All Figure Page
- Back to All Figure Page
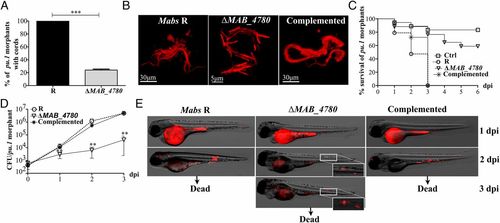
MABS_4780 is required for acute and lethal zebrafish infection. (A) Cords were recorded in pu.1 embryos infected i.v. with ~100-200 cfu of either tdTomato-expressing Mabs R, ΔMAB_4780, or the complemented strain at 2 and 3 dpi (n = 20). Percentage of pu.1 morphants harboring mycobacterial cords after infection with either the R variant or the ΔMAB_4780 mutant (n = 20) at 3 dpi. Data are expressed as means calculated from three independent experiments (n = 10 per experiment). The statistical test was Fisher’s exact test; ***P < 0.001. Error bars represent the SEM. (B) Maximum intensity projection of confocal images showing representative cords in pu.1 morphants i.v. infected with the Mabs R, ΔMAB_4780, and complemented strains expressing tdTomato at 2 dpi (<150 cfu). Only Mabs R and the complemented strain exhibited cords made of structured networks of multiple tight bundles, consisting of end-to-end and side-to-side parallel-aligned bacilli along the long axis of the cord, whereas extracellular growth of ΔMAB_4780 resulted essentially in size-limited and very thin structures. (C) Survival of macrophage-depleted embryos infected with 150 cfu at 30 hpf. Embryos are significantly more susceptible to R infection (P < 0.0001, log-rank test) than to ΔMAB_4780 infection (statistically not different from pu.1 morphant control). Shown are representative data of three independent experiments. (D) Growth kinetic of ΔMAB_4780 in pu.1 morphants (~100-200 cfu). The cfu enumeration showed reduced ΔMAB_4780 loads compared with R loads (**P < 0.01; Mann–Whitney test). Symbols represent means calculated from three independent experiments. Error bars represent the SEM. (E) Real-time imaging of pu.1 morphants infected as in B, with special emphasis on cording. Autofluorescence of the yolk is seen at 1 dpi. |
| Fish: | |
|---|---|
| Condition: | |
| Knockdown Reagents: | |
| Observed In: | |
| Stage Range: | Long-pec to Days 7-13 |