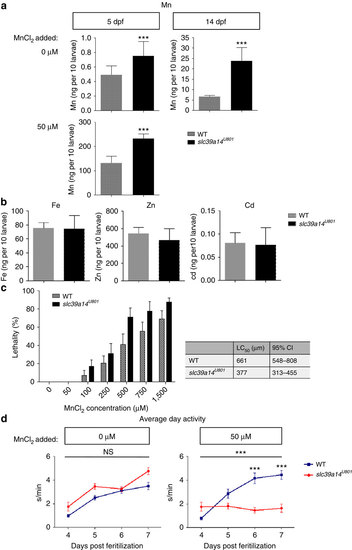
Loss of slc39a14 function in zebrafish leads to increased Mn accumulation and sensitivity as well as impaired locomotor behaviour. (a) Mn levels assessed in homozygous slc39a14U801 and wild-type (WT) larvae show that mutant larvae have significantly raised Mn levels at 5 dpf (P=0.001) and 14 dpf (P=0.0002), and Mn accumulation on MnCl2 exposure (50μM from 2 dpf) is significantly higher in mutant compared with WT larvae (P=0.000) at 5 dpf. Measurements were taken from pools of 10 larvae. Data are presented as means±s.d. from a minimum of five independent experiments. Statistical analysis was performed using Student’s two-tailed t-test (***P<0.001). (b) Graph showing Fe, Zn and Cd levels in 14 dpf mutant and WT larvae. Levels of all three metals are not significantly different between the two groups (P=0.906 [Fe], P=0.257 [Zn], P=0.834 [Cd]). Measurements were taken from pools of 10 larvae. Data are presented as means±s.d. from five independent experiments. Statistical analysis was performed using Student’s two-tailed t-test (NS, not significant). (c) Graph presenting the lethality in homozygous slc39a14U801 and WT larvae at 5 dpf on MnCl2 exposure between 2 and 5 dpf. Median lethal concentration (LC50) of MnCl2 determined by Probit regression analysis was 661μM for WT (95% confidence interval (CI) 548-808 μM) and 377 μM (95% CI 313-455 μM) for mutant fish. Data are presented as means±s.e.m. from nine independent experiments. (d) Locomotor behaviour studies of homozygous slc39a14U801 and WT larvae show that in unexposed conditions there is no significant difference in locomotor activity; and on MnCl2 exposure, locomotor activity is markedly reduced in mutant larvae compared with WT. The locomotor behaviour was tracked during 4 and 7 dpf using automated analysis software. s/min, movement in seconds per minute. Data are presented as means±s.e.m. 12 larvae were analysed per condition. Statistical analysis was performed using two way ANOVA (i, P=0.18; ii, P=0.000) (***P<0.001; NS, not significant). ANOVA, analysis of variance.
|
