
Fig. S3
- ID
- ZDB-FIG-160516-9
- Publication
- Ando et al., 2016 - Clarification of mural cell coverage of vascular endothelial cells by live imaging of zebrafish
- Other Figures
- All Figure Page
- Back to All Figure Page
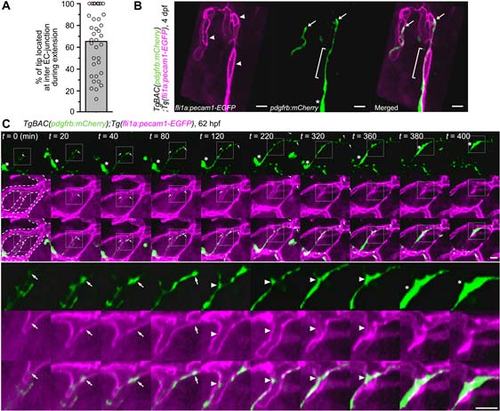
Extension of MC processes and MC migration along the inter-EC junctions. (A) Frequency of tip location of MC processes at the inter-EC junctions during their extension. By time-lapse imaging the TgBAC(pdgfrb:mCherry);Tg(fli1a:pecam1-EGFP) larvae as observed in Fig.3A, tip location of the MC process was examined every 15 or 20 min for more than 1 h. Data are expressed as a percentage of number of time points at which the tip of MC process located at the inter-EC junction among the total time points. Bar and circles indicate the average and the values of each process, respectively (n=36).(B) Confocal images of the MCs and inter-EC junctions in the CtA of the4dpf TgBAC(pdgfrb:mCherry);Tg(fli1a:pecam1-EGFP) larva. Left, fli1a:pecam1-EGFP; center, pdgfrb:mCherry; right, the merged image of fli1a:pecam1-EGFP(magenta) and pdgfrb:mCherry(green). Arrowheads indicate the inter-EC junctions visualized by Pecam1-EGFP, while arrows show the tip of MC processes. Brackets indicate the MC process aligned along the inter-EC junction. Asterisk indicates cell body of MC. The cell body of the MC shown in the left side of the image is out of frame. Scale bar, 10 µm.(C) Time-lapse confocal imagesof MC migration along the CtA in the hindbrain of the TgBAC(pdgfrb:mCherry);Tg(fli1a:pecam1-EGFP) larva. 3D-rendered confocal images and its subsequent time-lapse images with the elapsed time (min) at the top are shown, as in Fig. 3A. The boxed areas are enlarged beneath the original images. Dotted-lines in second and third rows of the leftmostcolumn outline the vessel morphology. Arrows indicate the tip of MC process, while asterisks show the cell body. Note that the tip of MC process moved forward along the inter-EC junction and that the MC-body (asterisks) was relocated to the preceding process which aligned along the inter-EC junctions (arrowheads). Scale bars, 10 µm. |