
Fig. 2
- ID
- ZDB-FIG-160516-2
- Publication
- Ando et al., 2016 - Clarification of mural cell coverage of vascular endothelial cells by live imaging of zebrafish
- Other Figures
- All Figure Page
- Back to All Figure Page
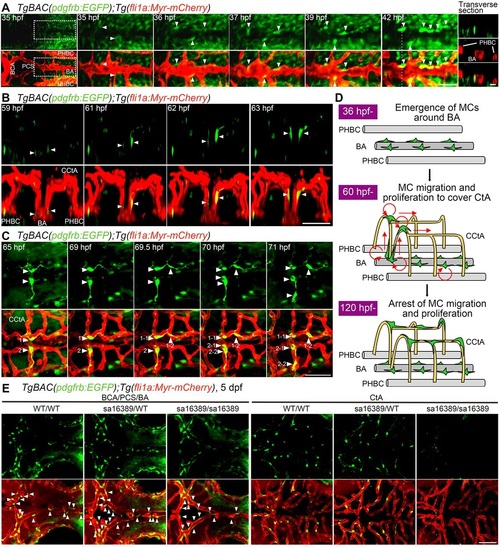
Live imaging of MC coverage in cranial vessels. (A-C) Time-lapse confocal images of the hindbrain vasculature in TgBAC(pdgfrb:EGFP);Tg(fli1a:Myr-mCherry) larvae at 35-42hfp (A), 59-63hpf (B) and 65-71hpf (C). Upper, pdgfrb:EGFP; lower, merged images of pdgfrb:EGFP (green) and fli1a:Myr-mCherry (red). (A) Dorsal view, anterior to the left. The central panels are enlarged and subsequent time-lapse images of the boxed areas in the leftmost column. The transverse sectional views of the areas indicated by dashed lines on the 42hpf image are shown in the rightmost column. Top, pdgfrb:EGFP (green); middle (rightmost column only), fli1a:Myr-mCherry (red); bottom, merged image. Note that the cells located in the vicinity of the BA (arrowheads) gradually emitted strong EGFP signal and tightly contacted ECs. (B) 3D-rendered confocal images of EGFP-positive cells (green) migrating along the CCtAs. Lateral view, dorsal to the top and anterior to the front. Note that EGFP-positive cells located around the BA (arrowheads) dorsally migrated along the CCtAs. (C) Dorsal view, anterior to the left. Arrowheads with numbers indicate individual EGFP-positive cells spreading on the CCtAs. Note that EGFP-positive cells spreading on the CCtA (1 and 2) divided into two daughter cells (1-1/1-2 and 2-1/2-2). (D) Schematic of how CCtAs become covered by MCs. MCs develop around the BA and migrate towards the CCtAs. During their migration, the MCs actively proliferate to cover the CCtAs. (E) Confocal images of hindbrain vasculature of pdgfrb wild-type (WT/WT), heterozygous (sa16389/WT) and homozygous (sa16389/sa16389) larvae in the TgBAC(pdgfrb:EGFP);Tg(fli1a:Myr-mCherry) background at 5dpf. Dorsal view, anterior to the left. The vessels in the cerebral base, such as BCA, PCA and BA (BCA/PCS/BA), and the CtA, are shown in the left and right columns, respectively. Upper, pdgfrb:EGFP; lower, merged images of pdgfrb:EGFP (green) and fli1a:Myr-mCherry (red). Arrowheads indicate MCs emerged around the BCA, PCS and BA. Scale bars: 20µm (transverse sectional image in A); 50µm (A,B,C,E). |
| Fish: | |
|---|---|
| Observed In: | |
| Stage: | Day 5 |