
Fig. 1
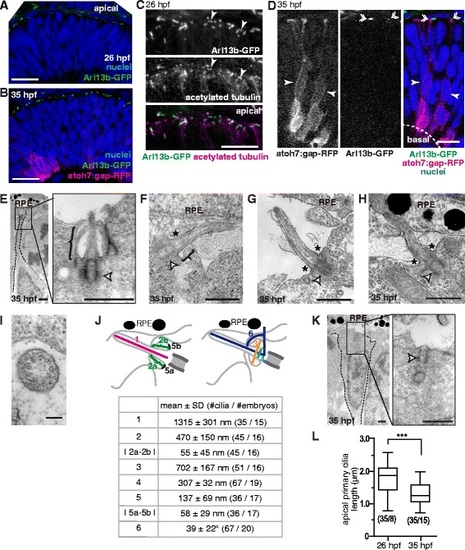
Main features of apical primary cilia in the early differentiating retinal neuroepithelium. The embryonic zebrafish retinal neuroepithelium was analyzed using confocal microscopy and TEM. a-b 26 hpf embryos expressing Arl13b-GFP (localized to primary cilia) (a) or double transgenic 35 hpf embryos expressing Arl13b-GFP and atoh7:gap-RFP (expressed in progenitors during the last cell cycle and in RGC neuroblasts) (b) were fixed and analyzed in toto using confocal microscopy. A 3D maximum intensity projection of a 3 µm-thick confocal stack is shown. c 26 hpf embryos expressing Arl13b-GFP were immunolabeled with anti-acetylated tubulin antibody. A maximum intensity projection of a 3 µm-thick stack of the apical region of the neuroepithelium is shown. The arrowheads show primary cilia with Arl13b-GFP and acetylated tubulin labeling. d Single confocal plane with a detail of the stack shown in b. It is possible to observe cells bearing a primary cilium (double arrowhead) and expressing low levels of gap-RFP (full arrowheads). e-h TEM micrographs showing examples of apical primary cilia, either with a complete (e, bracket), incomplete (f, bracket - asterisk) or absent ciliary pocket (g and h, asterisks). Primary cilia in close contact with RPE cells were also observed (h). The basal body is indicated with a white arrowhead. i Cross section of an apically localized primary cilium. j Morphological parameters of apical primary cilia of 35 hpf embryos obtained from measurements performed on TEM micrographs. Measured features are summarized in the upper diagrams, and values (mean ± standard deviation) shown in the lower table. k TEM micrograph showing a basal body (white arrowhead) associated with the apical plasma membrane but lacking an axoneme. l Comparison of apically-localized primary cilia length at 26 and 35 hpf. The numbers in brackets represent the number of cilia / embryos measured in each case. (***) p < 0.001, Student’s t test. RPE: retinal pigment epithelium. Scale bars: A-B, 20 µm; C-D, 10 µm; E, 1 µm; F-H, 0.5 µm; I, 0.1 µm; K, 1 µm |