
Fig. 1
- ID
- ZDB-FIG-160428-19
- Publication
- Jimenez et al., 2016 - Phenotypic chemical screening using zebrafish neural crest reporters identifies retinoid acid as an inhibitor of epithelial morphogenesis
- Other Figures
- All Figure Page
- Back to All Figure Page
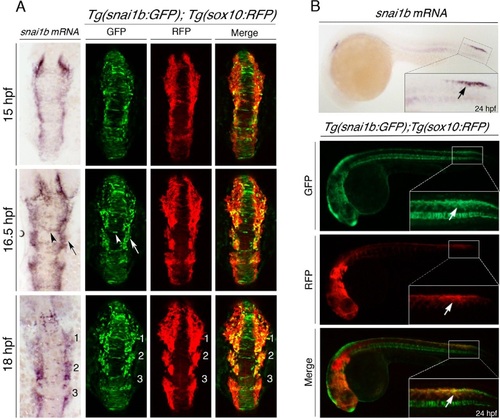
Generating a NC EMT reporter during development. (A) Dorsal views of whole-mount in situ hybridization of snail1b mRNA expression (left) compared to maximal z-projections of double-transgenic Tg(snai1b:GFP); Tg(sox10:RFP) zebrafish embryos (right) at the indicated developmental time points. Tg(snai1b:GFP) expresses GFP in the neuroepithelium (white arrowhead) and neural plate border cells (white arrow), similar to endogenous snail1b mRNA expression (black arrow and arrowhead). Comparison of Tg(snai1b:GFP) with Tg(sox10:RFP) shows that GFP is expressed in both the neuroepithelium and lateral plate border, whereas RFP labels delaminating NC cells at the neural plate border, partially overlapping with GFP (yellow cells). In migrating NC cells, GFP and RFP are co-expressed in the first two cranial streams (numbered). (B) Lateral views of brightfield (top) or epifluorescent (bottom) images of 24-hpf embryos comparing snail1b mRNA in situ hybridization expression in the trunk NC and Tg(snai1b:GFP); Tg(sox10:RFP) embryos, showing that Tg(snai1b:GFP) labels the same region as endogenous snail1b mRNA and co-labels with sox10:RFP in trunk NC cells (white arrows). |