
Fig. 4
- ID
- ZDB-FIG-160420-6
- Publication
- Stiff et al., 2016 - ATR promotes cilia signalling; links to developmental impacts
- Other Figures
- All Figure Page
- Back to All Figure Page
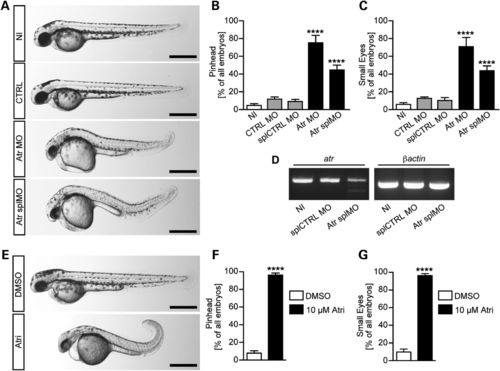
Morphological changes caused by Atr depletion in zebrafish. (A) Live images of 48 hpf zebrafish embryos. As controls, zebrafish were either left uninjected (NI) or control injected (CTRL) with a standard control MO (CTRL MO) or a 5 base mismatch MO (splCTRL MO), respectively. To generate Atr loss of function, injections with a translation blocking MO against Atr (Atr MO) or an MO interfering with Atr splicing (Atr splMO) were performed. Scale bars: 500 µm. (B) The percentage of embryos with an underdeveloped head. Graph displays mean values ± SEM, and n = 111-193 embryos in 5-11 experiments. ****P < 0.0001, one-way ANOVA. (C) Loss of Atr interferes with regular eye development. Graph displays means ± SEM, and n = 93-113 embryos in 5-11 experiments. ****P < 0.0001, one-way ANOVA. (D) Representative images of RT-PCR experiments assessing splice blocking efficiency of Atr splMO compared with controls. Left panel shows PCR of exons 2-4 of atr with a weaker band at the expected size and an additional smaller band representing the mis-spliced product upon Atr splMO injection. Right panel shows a PCR fragment of βActin as loading control. (E) Live images of zebrafish embryos (48 hpf) treated with either 1% DMSO or 10 µm Atr inhibitor (ATRi-1) from the tailbud stage on. Scale bars: 500 µm. (F) Inhibition of Atr by chemical means (ATRi-1) results in a similar reduction of the head size of 48 hpf embryos. Graph displays mean values ± SEM, and n = 95-217 embryos in five experiments. P < 0.0001, Student′s t-test. (G) The percentage of embryos developing smaller eyes upon Atr inhibition. Results show the mean values ± SEM, and n = 95-217 embryos in five experiments. P < 0.0001, Student′s t-test. |
| Fish: | |
|---|---|
| Condition: | |
| Knockdown Reagents: | |
| Observed In: | |
| Stage: | Long-pec |