
FIGURE
Fig. S14
Fig. S14
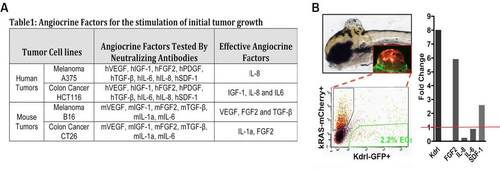
(A) Table 1 summarizes the effective angiocrine factors in the EC-CM identified using neutralizing antibodies. (B) The strategy for isolating the endothelial cells in endogenous zebrafish Glioma microtumors. (L) qPCR quantification of FGF2 and SDF-1 overexpression in the microtumor ECs, using GFP negative cells of the microtumors as control (red line indicates control expression level). (*p < 0.05, **p < 0.01). |
Expression Data
Expression Detail
Antibody Labeling
Phenotype Data
Phenotype Detail
Acknowledgments
This image is the copyrighted work of the attributed author or publisher, and
ZFIN has permission only to display this image to its users.
Additional permissions should be obtained from the applicable author or publisher of the image.
Full text @ Sci. Rep.