
FIGURE
Fig. S3
Fig. S3
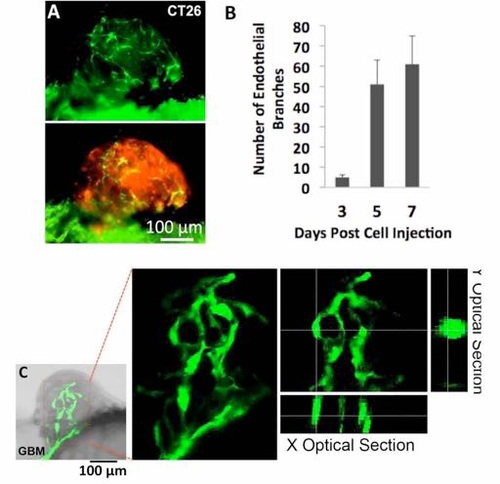
Endothelial cords in xenografted CT26 microtumors and human glioblastoma (GBM) in zebrafish. (A) A CT26 microtumor (red, stained by FAST Dil) with endothelial cords in Tg(flk: eGFP) zebrafish on 6 dpi. (B) Quantitative analysis of the number of endothelial branches in the microtumors with time (>20 for each group, scale bars show SEM). (C) Endothelial cords in human GBM xenograft in zebrafish. |
Expression Data
Expression Detail
Antibody Labeling
Phenotype Data
Phenotype Detail
Acknowledgments
This image is the copyrighted work of the attributed author or publisher, and
ZFIN has permission only to display this image to its users.
Additional permissions should be obtained from the applicable author or publisher of the image.
Full text @ Sci. Rep.