
Fig. 1
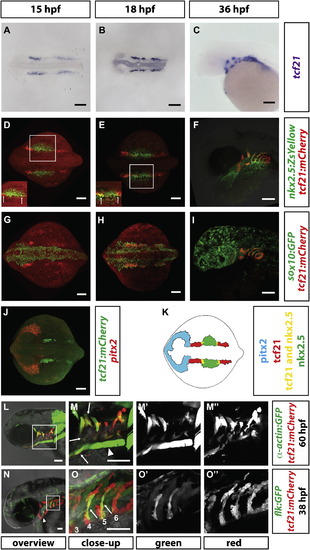
Expression of tcf21 during Head Formation (A–C) Staining of tcf21 mRNA in wild-type embryos of indicated stages. n > 7. (D–I) Images of fixed embryos of the indicated stages and genotypes stained for mCherry and ZsYellow proteins (D–F) or mCherry and GFP (G–I). White squares in (D) and (E) indicate region shown with increased intensity to demonstrate domain overlap in insets in (D) and (E). sox10:GFP was used to mark the neural crest contribution to the pharyngeal arches. Arrows in insets indicate region where tcf21 and nkx2.5 are co-expressed. n = 5 for (D) and (E); n = 1 for (F); n = 5 for (G); n = 2 for (H); n = 1 for (I). (J) Staining of pitx2 mRNA and mCherry protein in a 15-somite stage embryo (n = 13). (K) Schematic summary of pitx2, tcf21, and nkx2.5 expression in the head mesoderm in the 14-somite stage embryo. Note that in this study, the term “head mesoderm” refers to the mesoderm comprised of the prechordal plate mesoderm, the pharyngeal mesoderm, and the cardiac mesoderm. Pitx2, tcf21, and nkx2.5 mark—possibly only parts of—the prechordal plate, pharyngeal mesoderm, and pharyngeal mesoderm/secondary heart field mesoderm, respectively. (L–M′′) Live images of 60 hpf embryos carrying indicated transgenes. Square in (L) indicates magnified region in (M). (M′) and (M′′) show single fluorescent channels. Arrows in (M) indicate some of the tcf21+ muscles. Note that the prechordal plate-derived extraocular muscles (asterisk in M) and the somite-derived sternhyoideus muscles (arrowhead in M) do not express tcf21. (N–O′′) Live images of 38 hpf embryo carrying indicated transgenes. Square in (N) indicates magnified region in (O). (O′) and (O′′) show single fluorescent channels. Arrowhead in (N) indicates the HA progenitors. Arrows in (O) indicate tcf21+ pPAA progenitors, and the numbers label the arches. Note that the flk:GFP transgenic line weakly labels the pharyngeal endoderm and that PAA3 has already formed and lumenized and therefore is difficult to see in this projection. Scale bars represent 100 µm (A–J, L, and M) or 50 µm (N and O). Anterior is to the left. Dorsal views (A, B, D, E, G, H, and J) and lateral views (C, F, I, and L–O). |