
Fig. S4
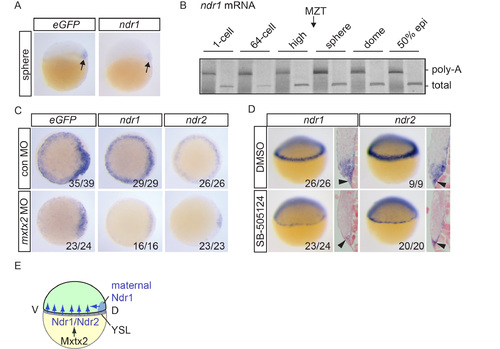
Initiation of Nodal signaling in Tg(ARE:eGFP) embryos (A) eGFP and ndr1 expression in sphere stage embryos. Arrows indicate dorsal expression domains. (B) ePAT for ndr1 mRNA. A silver-stained, non-denaturing polyacrylamide gel is shown indicating total and polyadenylated mRNA. Poly-A, polyadenylated; MZT, maternal to zygotic transition. (C) eGFP, ndr1 and ndr2 expression in dome stage Tg(ARE:eGFP) embryos injected with control (con) or mxtx2 MOs. Animal views are shown. (D) Lateral views and sections of 30-40% epiboly embryos treated with DMSO or SB- 505124 at the 32-cell stage and stained for ndr1 and ndr2 expression. Black arrowheads indicate expression in the YSL. (E) Schematic representation showing how Nodal signaling is initiated in zebrafish embryos. For details, see text. |
Reprinted from Developmental Cell, 35, van Boxtel, A.L., Chesebro, J.E., Heliot, C., Ramel, M.C., Stone, R.K., Hill, C.S., A Temporal Window for Signal Activation Dictates the Dimensions of a Nodal Signaling Domain, 175-185, Copyright (2015) with permission from Elsevier. Full text @ Dev. Cell