
Fig. S3
- ID
- ZDB-FIG-151120-28
- Publication
- Dzafic et al., 2015 - Centriole Amplification in Zebrafish Affects Proliferation and Survival but Not Differentiation of Neural Progenitor Cells
- Other Figures
- All Figure Page
- Back to All Figure Page
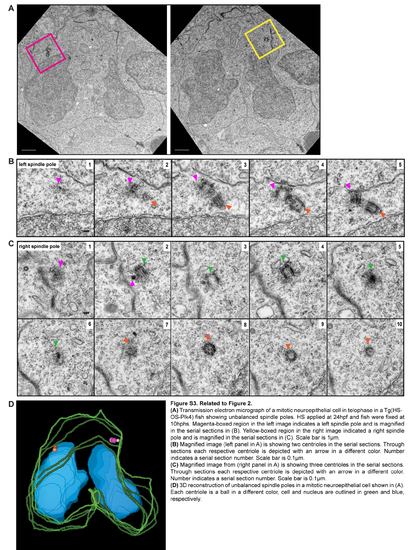
Related to Figure 2. (A) Transmission electron micrograph of a mitotic neuroepithelial cell in telophase in a Tg(HSOS-Plk4) fish showing unbalanced spindle poles. HS applied at 24hpf and fish were fixed at 1 0hphs. Magenta-boxed region in the left image indicates a left spindle pole and is magnified in the serial sections in (B). Yellow-boxed region in the right image indicated a right spindle pole and is magnified in the serial sections in (C). Scale bar is 1µm. (B) Magnified image (left panel in A) is showing two centrioles in the serial sections. Through sections each respective centriole is depicted with an arrow in a different color. Number indicates a serial section number. Scale bar is 0.1 µm. (C) Magnified image from (right panel in A) is showing three centrioles in the serial sections. Through sections each respective centriole is depicted with an arrow in a different color. Number indicates a serial section number. Scale bar is 0.1 µm. (D) 3D reconstruction of unbalanced spindle poles in a mitotic neuroepithelial cell shown in (A). Each centriole is a ball in a different color, cell and nucleus are outlined in green and blue, respectively. |