
Fig. 5
- ID
- ZDB-FIG-150929-14
- Publication
- Lippok et al., 2014 - Pou5f1 protein expression and posttranslational modification during early zebrafish development
- Other Figures
- All Figure Page
- Back to All Figure Page
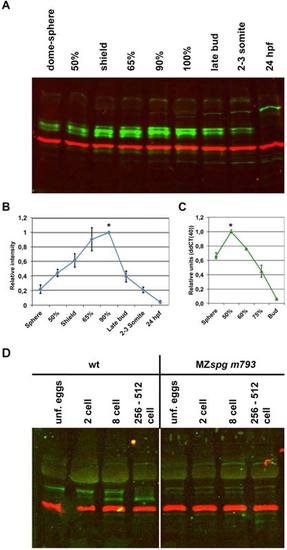
Temporal Pou5f1 profile during early embryo development. A: Pou5f1 protein amounts (green, around 60 kDa) from 4 hr postfertilization (hpf) to 24 hpf wild-type (WT) whole embryo extracts analyzed by fluorescent Western blot analysis. α-tubulin is shown as loading control (red, 55 kDa). In the Western blot, an additional faint higher molecular weight band is detected at approximately 150 kDa from mid-gastrula on, and a second band appears from the end of gastrulation at approximately 100 kDa. These bands are also present in MZspg embryos, and thus do not correspond to Pou5f1 forms but are nonspecific bands. B: Relative quantification of Pou5f1 immunoreactive band intensity from 4 to 24 hpf indicates that Pou5f1 protein amount is highest between 6 hpf (65% epiboly stage) and 10 hpf (100% epiboly stage). Pou5f1 band intensity values were normalized using the α-tubulin band intensity values. The Pou5f1 protein signal in WT at 90% epiboly stage was set to 100%. C: Relative quantification of pou5f1 mRNA message from 4 hpf (sphere) to 10 hpf (bud) by quantitative reverse transcriptase-polymerase chain reaction (RT-PCR). pou5f1 mRNA amount is highest at 50% epiboly stage and decays afterward. Elongation factor alpha (eef1a1a) was used as a normalization control. pou5f1 mRNA signal in WT at 50% epiboly stage was set to 100%. D: Pou5f1 at pre-MBT stages. Pou5f1 protein is already present in unfertilized eggs, but the band is shifted to higher molecular mass compared with a new Pou5f1 band that appears faintly at two-cell stage and then prominently from eight-cell stage on. The right part shows absence of Pou5f1 bands from MZspg mutant embryos. Fluorescent Western blot analysis using P2 Pou5f1 antibody (green) and anti-α-tubulin as loading control (red, 55 kDa). |
| Gene: | |
|---|---|
| Antibody: | |
| Fish: | |
| Anatomical Term: | |
| Stage Range: | Dome to Prim-5 |