
Fig. 5
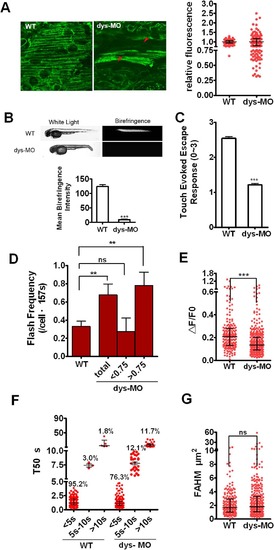
Mitoflashes are switched to lower ΔF/F0 amplitude and R-type mitoflashes in dystrophin morphants. (A) Live images of mitoflashes in mitochondria of a wild-type mt-cpYFP transgenic embryo and dys-MO morphant (left) and the relative fluorescence between them (right). Note the heterogeneity of cpYFP signals in red muscle cells in dystrophin morphants, giving rise to a highly scattered cellular cpYFP intensity distribution (A, arrowheads). About half of the cells in morphants showed relative fluorescent <0.75 to the average. (B) Upper: Birefringence was determined in embryos of wild type (WT) and dystrophin morphant (dys-MO). Corresponding bright-field images were shown in the left panels. Note the diminished birefringence in a dys-MO morphant. Lower: statistic of the mean birefringence intensity between the two groups. (C) Touch-evoked escape response was determined in 56 hpf embryos. Note reduced motor function of dys-MO morphants. (D-G) Mitoflash frequency, ΔF/F0, T50 and FAHM of red skeletal muscle cells were measured in a wild-type transgenic embryo (WT) and dys-MO morphant (dys-MO). When dys-MO cells were divided into 2 subsets of relative fluorescence, the cells with relative fluorescence >0.75 showed higher frequency that led to overall higher mitoflash frequency in dys-MO morphants than WT. Note ΔF/F0 amplitude decreased while FAHM had no changes, but T50 (>10s) increased due to longer T50 for S-type mitoflashes and the emergence of transitory and R-type mitoflashes in dystrophin morphants. For mitoflash analysis of WT embryos and dys-MO morphants at 2 dpf, we examined 8 and 11 individual embryos, as well as generated 43 and 57 frames for red muscle fibers, respectively. Data were reported as median with interquartile range at 1/4, 1/2 and 3/4 of the data, respectively (Fig 5A, E-G) and mean ± SEM (for Fig 5B-D). Unpaired t test with Welch’s correction (Fig 5A-D) and Mann-Whitney test (Fig 5E and G) was applied to determine statistical significance of the differences. **: p <0.01 versus wild-type group, ***: p <0.0001 versus wild-type group. |
| Gene: | |
|---|---|
| Fish: | |
| Knockdown Reagent: | |
| Anatomical Term: | |
| Stage: | Long-pec |
| Fish: | |
|---|---|
| Knockdown Reagent: | |
| Observed In: | |
| Stage: | Long-pec |