
Fig. 7
- ID
- ZDB-FIG-150923-25
- Publication
- Esain et al., 2015 - Cannabinoid Receptor-2 Regulates Embryonic Hematopoietic Stem Cell Development via PGE2 and P-selectin Activity
- Other Figures
- All Figure Page
- Back to All Figure Page
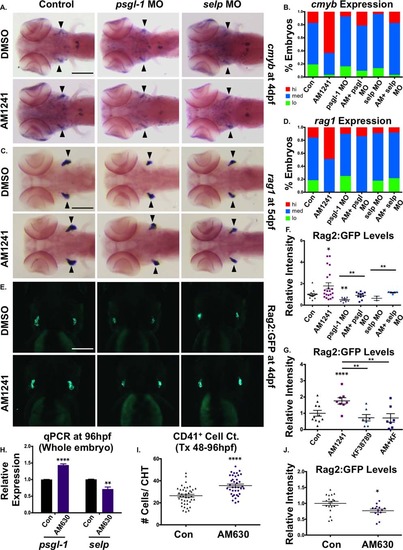
CNR2-signaling promotes thymic colonization via P-selectin activity. (A): MO-mediated knockdown of psgl-1 and selp reduced cmyb expression in the thymus and prevented AM1241 (30–96 hpf) from increasing thymic colonization (n e 50 per condition). (B): Qualitative phenotypic distribution of embryos from panel (A), scored with low, medium, or high cmyb expression in the thymus at 96 hpf. (C): MO-mediated knockdown of psgl-1 and selp, as described in panel (A), decreased rag1 expression in the thymus in the presence and absence of AM1241 (30–120 hpf) (n e 35 per condition). (D): Qualitative phenotypic distribution of embryos from panel (C), scored with low, medium, or high rag1 expression in the thymus at 96 hpf. (E): In vivo imaging of rag2:egfp embryos confirmed that psgl-1- and selp-MOs decreased the number of Rag2:GFP+ lymphoid progenitors in the thymus both with and without AM1241-treatment (n e 8 per condition). (F): Relative fluorescent intensity of the thymus in morphant embryos, as described in panel (E) (control/DMSO: 1.00 ± 0.10 a.u., psgl-1 MO/DMSO:0.51 ± 0.08, selp MO/DMSO: 0.64 ± 0.29, Control/AM1241: 1.79 ± 0.29 a.u., psgl-1 MO/AM1241: 0.91 ± 0.09, selp MO/AM1241: 1.17 ± 0.53; *, p d .05; **, p d .01, one-tailed t test). (G): Exposure to KF38789 (30–96 hpf) confirmed the role of P-selectin in normal and AM1241-enhanced thymic colonization, as indicated by Rag2:GFP at 96 hpf (DMSO: 1.00 ± 0.18 a.u., AM1241: 1.76 ± 0.20, KF38789: 0.73 ± 0.20, AM1241+KF38789: 0.71 ± 0.26; **, p d .01; ****, p d .0001, two-tailed t test, n e 7 per condition). (H): qPCR analysis showed that exposure to AM630 after the phase of HSC induction (48–96 hpf) altered the expression of psgl-1 and selp (psgl-1: 1.44-fold, selp: 0.72-fold, **, p d .01; ****, p d .0001, two-tailed t test). (I): Absolute counts of CD41:GFP+ cells revealed that exposure to AM630, as described in panel (H), increased the number of HSCs remaining in the CHT at 96 hpf (DMSO: 26.4 ± 1.3, AM630: 35.6 ± 1.4; ****, p d .0001, two-tailed t test, n e 38,). (J): Relative fluorescent intensity of Rag2:GFP+ cells the thymus following exposure to AM630, as described in panel (G), indicated CNR2-signaling was required for thymic colonization (DMSO: 1.0 ± 0.06 a.u., AM630: 0.77 ± 0.05 a.u.; *, p d .05, two-tailed t test, n e 14). Scale bars (A, C) = 200 µm, (E) = 175 µm. Abbreviations: DMSO, dimethyl sulfoxide; GFP, green fluorescent protein; MO, morpholino; psgl-1, p-selectin glycoprotein ligand-1; qPCR, quantitative polymerase chain reaction; sele, e-selectin. |
| Genes: | |
|---|---|
| Fish: | |
| Condition: | |
| Knockdown Reagents: | |
| Anatomical Terms: | |
| Stage Range: | Day 4 to Day 5 |