
Fig. 1
- ID
- ZDB-FIG-150923-19
- Publication
- Esain et al., 2015 - Cannabinoid Receptor-2 Regulates Embryonic Hematopoietic Stem Cell Development via PGE2 and P-selectin Activity
- Other Figures
- All Figure Page
- Back to All Figure Page
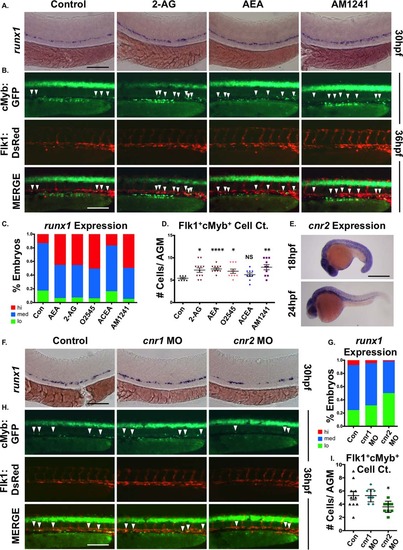
CNR2 modulates hematopoietic stem cell (HSC) formation during embryogenesis. (A): Embryonic exposure to endogenous (2-AG, 5 µM; AEA, 5 µM) or synthetic (AM1241, CNR2-selective agonist, 10 µM) cannabinoids during HSC formation (12–30 hpf) increased runx1 expression in the AGM (n e 90 per condition). (B): In vivo imaging of flk1:dsRed;cmyb:egfp embryos indicated the number of Flk1:dsRed+;cMyb:GFP+ HSCs (arrowheads) was increased in the AGM at 36 hpf following exposure to endogenous and synthetic cannabinoid compounds (n e 7 per condition). (C): Qualitative phenotypic distribution of embryos from panel (A) and Supporting Information Figure S1A scored with low, medium, or high runx1 expression in the AGM (O2545: dual CNR1/2 agonist, 5 µM, ACEA: CNR1-selective agonist, 5 µM). (D): Absolute counts of Flk1:dsRed+cMyb:GFP+ HSCs in embryos from panel (B) and Supporting Information Figure S1B (DMSO: 5.4 ± 0.5, 2-AG: 7.3 ± 1.7, AEA: 7.5 ± 2.4, O2545: 7 ± 1.5, ACEA: 6.2 ± 1.2, AM1241: 7.9 ± 1.9; *, p d .05; **, p d .01; ****, p d .0001, two-tailed t test). (E): Whole-mount in situ hybridization of wild type embryos at 18 and 24 hpf showed cnr2 was expressed throughout the embryo and enriched in the AGM region at the time of HSC specification. (F): MO-mediated knockdown of cnr1 or cnr2 revealed that CNR2, but not CNR1, was required for normal runx1 expression (n ≥ 150 per condition). (G): Qualitative phenotypic distribution of embryos from panel (F) scored with low, medium, or high runx1 expression in the AGM. (H): In vivo imaging confirming the number of Flk1:dsRed+;cMyb:GFP+ HSCs (arrowheads) was decreased in the AGM at 36 hpf following cnr2, but not cnr1, MO-mediated knockdown (n ≥ 10 per condition). (I): Absolute counts of Flk1:dsRed+cMyb:GFP+ HSCs from embryos in panel (B) (uninjected: 5.3 ± 0.7, cnr1 MO: 5.3 ± 0.3, cnr2 MO: 3.6 ± 0.3; *, p < .05, two-tailed t test). Scale bars: (A, B, F, H) = 100 µm, (E) =500 µm. Abbreviations: 2AG, 2-arachidonoylglycerol; AEA, anandamide; AGM, aorta-gonad-mesonephros; MO, morpholino. |
| Genes: | |
|---|---|
| Fish: | |
| Conditions: | |
| Knockdown Reagents: | |
| Anatomical Terms: | |
| Stage Range: | 14-19 somites to Prim-25 |
| Fish: | |
|---|---|
| Conditions: | |
| Knockdown Reagent: | |
| Observed In: | |
| Stage: | Prim-25 |