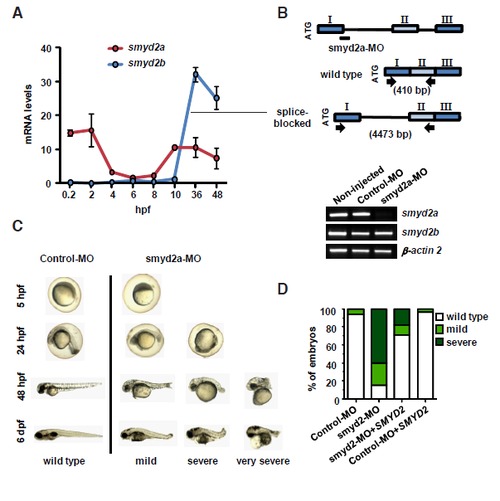
smyd2a knockdown in zebrafish development. (A) smyd2a and smyd2b mRNA levels at different hours post fertilization (hpf). Levels were determined by qPCR and normalized to 18S. Two independent experiments were carried out and one representative experiment is shown. Mean and standard deviation from two independent quantifications are shown. (B) The upper panel shows a schematic representation of the splice-blocking morpholino smyd2a-MO at the exon1-intron 1 junction. Specific primers for smyd2a were designed at each side of exon 1 and intron 1 flanking a region of 410 bp in wild type mRNA, and 4473 bp in unspliced mRNA. Lower panel shows the absence of mature smyd2a mRNA at 24 hpf in smyd2a-MO compared to Control-MO and non-injected embryos. Expression of smyd2b was unaffected by the smyd2a-MO injection. b-actin 2 was used as control. (C) Different phenotypes at 5, 24, 48 hpf and 6 dpf of embryos injected with Control-MO and smyd2a-MO. (D) Percentage of phenotypes of morpholino injection (Control-MO and smyd2a-MO) and rescue experiment (smyd2a-MO + SMYD2 mRNA and Control-MO + SMYD2 mRNA) at 24 hpf. Means from three independent experiments are shown.
|
