
Fig. 1
- ID
- ZDB-FIG-150805-7
- Publication
- Compagnon et al., 2014 - The Notochord Breaks Bilateral Symmetry by Controlling Cell Shapes in the Zebrafish Laterality Organ
- Other Figures
- All Figure Page
- Back to All Figure Page
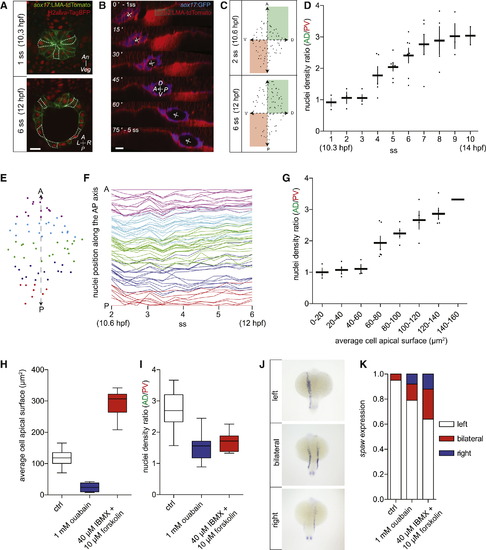
Lumen Growth Drives Cell Shape Change within KV (A) Coronal sections of KV in a Tg(sox17:LMA-tdTomato) embryo, which expresses plasma membrane-targeted tdTomato in KV cells and was injected with h2afva-tagBFP mRNA to label cell nuclei; upper panel, 1 ss (10.3 hpf); lower panel, 6 ss (12 hpf). (B) Sagittal sections of sequential time points during KV formation in a Tg(sox17:GFP; actb2:LMA-tdTomato) embryo starting at 1 ss (10.3 hpf). (C) KV nuclei density distribution along the AP and DV axes during KV formation in a Tg(sox17:GFP) embryo injected with h2afva-mCherry and LMA-tagBFP mRNA at 2 ss (10.6 hpf; upper plot) and 6 ss (12 hpf; lower plot). (D) KV nuclei density ratio between the AD and PV quadrants of KV between 1 ss and 10 ss (10.3–14 hpf); mean ± SEM; n = 11 embryos; data were polled from Tg(sox17:GFP) and Tg(sox17:LMA-tdTomato) embryos. (E and F) In (E), a lateral nuclei density plot is shown of KV in a Tg(sox17:GFP) embryo injected with h2afva-mCherry and LMA-tagBFP mRNA at the 2 ss (10.6 hpf) showing the color code used in (F) to plot changes in cell position along a normalized AP axis between 2 ss and 6 ss (10.3–12 hpf). (G) KV nuclei density ratio between the AD and PV quadrants as a function of average KV cell apical surface in 1 ss to 10 ss embryos (10.3–14 hpf; mean ± SEM); n = 11 embryos; data were polled from Tg(sox17:GFP) and Tg(sox17:LMA-tdTomato) embryos. (H) Average KV cell apical surface in control (n = 31 time points), ouabain-treated (n = 14 time points), and IBMX + forskolin-treated (n = 7 time points) Tg(sox17:GFP) embryos; data were polled from 5 ss to 7 ss embryos (11.6 - 12.5 hpf). (I) KV nuclei density ratio between the AD and PV quadrants in control (n = 31 time points), ouabain-treated (n = 14 time points), and IBMX + forskolin-treated (n = 7 time points) Tg(sox17:GFP) embryos; data were polled from 5 ss to 7 ss embryos (11.6–12.5 hpf). (J) Phenotypic classes defined for scoring the lateralization of spaw expression by in situ hybridization between 18 ss and 22 ss (18–20 hpf). (K) Quantification of the lateralization of spaw expression in control (n = 77 embryos), ouabain-treated (n = 24 embryos), and IBMX + forskolin-treated (n = 33 embryos) Tg(sox17:GFP) embryos. A, anterior; P, posterior; L, left; R, right; V, ventral; D, dorsal; An, Animal pole; Veg, vegetal pole; ctrl, control. Scale bars in (A) and (B), 20 µm. See also Figure S1. |
Reprinted from Developmental Cell, 31, Compagnon, J., Barone, V., Rajshekar, S., Kottmeier, R., Pranjic-Ferscha, K., Behrndt, M., Heisenberg, C., The Notochord Breaks Bilateral Symmetry by Controlling Cell Shapes in the Zebrafish Laterality Organ, 774-783, Copyright (2014) with permission from Elsevier. Full text @ Dev. Cell