
Fig. 1
- ID
- ZDB-FIG-150526-1
- Publication
- Ye et al., 2015 - glucagon is essential for alpha cell transdifferentiation and beta cell neogenesis
- Other Figures
- All Figure Page
- Back to All Figure Page
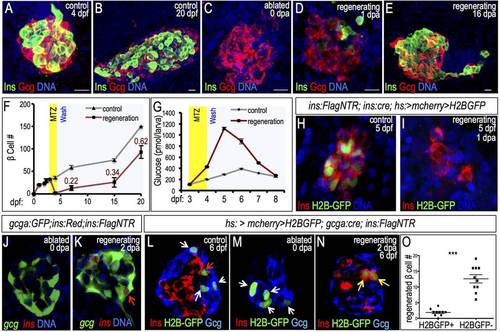
β cell neogenesis from α cell transdifferentiation in zebrafish. (A-E) Confocal projections showing α (red) and β (green) cells in the principal islet of intact (A,B) and ablated (C-E) Tg(ins:CFP-NTR) larvae at 0, 1 and 16days post ablation (dpa). Scale bars: 10 µm. (F) Quantification of insulin+ cells in intact (gray line) and regenerating (red line) islets from 0 to 20dpf (ne3 for all groups except control 20dpf, n=1). The ratio of β cells in regenerating versus control islets is indicated. (G) Blood glucose measurements of non-ablated larvae (gray) and larvae in which β cells were ablated from 3-4dpf (red) (n=3). (H,I) Confocal projections of β cell lineage-marked islets in 5-dpf control and 1-dpa Tg(ins:Cre); Tg(hs:CSH); Tg(ins:Flag-NTR) larvae. β cells were labeled by inducible H2B-GFP at 3dpf before ablation and stained for GFP (green) and insulin (red). (J,K) Confocal planes of ablated (J) and regenerating (K) islets in Tg(ins:Flag-NTR); Tg(gcga:GFP); Tg(ins:dsRed) larvae. Red arrow in K indicates gcga:GFP+ ins:dsRed+ β cells in regenerating islet. (L-N) Confocal planes of Tg(gcga:Cre); Tg(hs:CSH); Tg(ins:Flag-NTR) islets labeled by H2B-GFP before ablation, and stained for GFP (green), insulin (red) and glucagon (blue). α cells are indicated by white arrows and β cells by the red arrow. (L) 6-dpf non-ablated islet, (M) 4-dpf ablated islet at 0dpa, and (N) 6-dpf islet at 2dpa. H2B-GFP+ regenerating β cells are indicated with yellow arrows. (O) Quantification of H2B-GFP+ and H2B-GFP β cells in 2-dpa islets (n=10). ***P≤0.001 (Student′s t-test). |
| Genes: | |
|---|---|
| Antibody: | |
| Fish: | |
| Conditions: | |
| Anatomical Terms: | |
| Stage Range: | Day 4 to Days 14-20 |