
Fig. 5
- ID
- ZDB-FIG-150428-30
- Publication
- Sarmah et al., 2013 - Ethanol exposure disrupts extraembryonic microtubule cytoskeleton and embryonic blastomere cell adhesion, producing epiboly and gastrulation defects
- Other Figures
- All Figure Page
- Back to All Figure Page
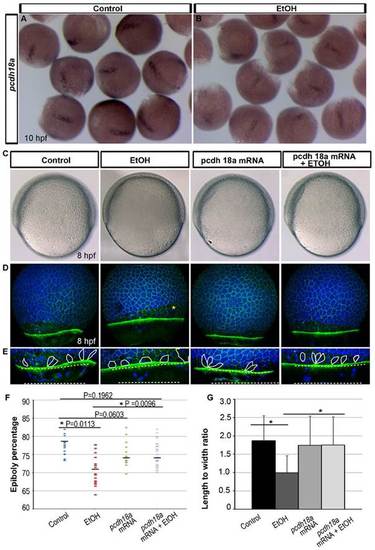
Ethanol induced epiboly defect was rescued by pcdh18a mRNA injection. (A,B) Whole mount in situ hybridization detecting pcdh18a mRNA showed reduced expression in the ethanol treated 10hpf embryos as compared to control. (C) Bright field images focused at the EVL margin showed epiboly progression in the control, ethanol treated, pcdh18a mRNA injected, and pcdh18a mRNA injected plus ethanol treated embryos. (D) 3D renderings of confocal microscopy optical sections of phalloidin stained embryos co-labelled with TO-PRO-3 showed reduced epiboly in the ethanol treated embryos. Epiboly progression was similar in the control, pcdh18a mRNA injected, and pcdh18a mRNA injected plus ethanol treated embryos. Yellow asterisk indicates big multiucleated cells. (E) High magnification images of the embryos highlighting cell boundaries of a few EVL cells. Control, mRNA injected, and mRNA injected plus ethanol treated embryos showed elongated EVL cells; ethanol treated embryos showed rounder EVL cells that were not correctly aligned. Yellow perforated line: EVL margin; white line: yolk syncytial nuclei margin. Note: mRNA injected plus ethanol treated embryos showed more YSL nuclei beyond the EVL as compared to ethanol treated embryo. (F) Scatter plot representation shows reduced epiboly movement in ethanol treated embryos compared to control. These reduced epiboly movements were rescued by pcdh18a mRNA injection. (G) Histogram shows rescue by pcdh18a mRNA injection of the EVL cells length-to-width ratios at the embryo margins, which are reduced after ethanol treatment. Asterisks indicate statistical significance: *P<0.0001. |
| Gene: | |
|---|---|
| Fish: | |
| Condition: | |
| Anatomical Term: | |
| Stage: | Bud |
| Fish: | |
|---|---|
| Condition: | |
| Observed In: | |
| Stage Range: | 75%-epiboly to Bud |