
Fig. 5
- ID
- ZDB-FIG-150326-11
- Publication
- Fiengo et al., 2013 - Developmental expression pattern of two zebrafish rxfp3 paralogue genes
- Other Figures
- All Figure Page
- Back to All Figure Page
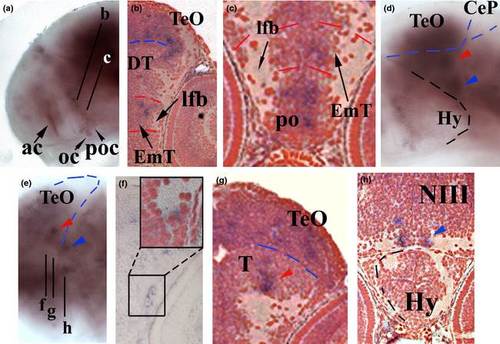
Expression of rxfp3-2b in the central region of the 96 h postfertilization (hpf) larval brain. (a) Lateral view of the brain. (b) Counter-stained transverse section as indicated in (a). (c) Magnification of ventral part of transverse section as indicated in (a). (d) Lateral view of the larval brain at level of hypothalamus. (e) Dorsal view of the larval brain at level of hypothalamus. (f) Transverse section as indicated in (e). In the inset is reported a magnification of counter-stained tranverse section of the region indicated in (f). (g) Counter-stained transverse section as indicated in (e). (h) Counter-stained transverse section as indicated in (e). Blue and red arrowheads indicate cell clusters in the tegmentum region. ac, anterior commissure; CeP, cerebellar plate; DT, dorsal thalamus; EmT, Eminenthia Thalami; Hy, hypothalamus; lfb, lateral forebrain bundle; NIII, nuclei of NIII cranial nerve; oc; optic chiasma; po; preoptic region; poc, postoptic commissure; T, tegmantum; TeO, optic tectum. |
| Gene: | |
|---|---|
| Fish: | |
| Anatomical Terms: | |
| Stage: | Day 4 |