
Fig. 4
- ID
- ZDB-FIG-150326-10
- Publication
- Fiengo et al., 2013 - Developmental expression pattern of two zebrafish rxfp3 paralogue genes
- Other Figures
- All Figure Page
- Back to All Figure Page
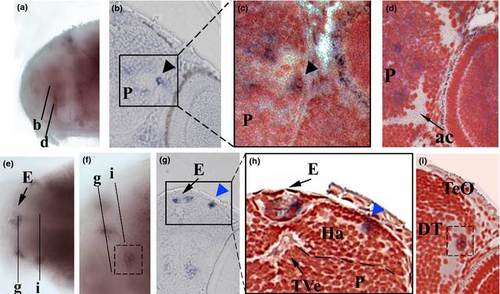
Expression of rxfp3-2b in the anterior region of the 96 h postfertilization (hpf) larval brain. (a) Lateral view of the brain. (b) Transverse section as indicated in (a). (c) Magnification of counter-stained transverse section of the region indicated in (b). (d) Transverse section as indicated in (a). (e) Dorsal view of the larval brain at level of epiphysis. (f) Lateral view of the larval brain at level of epiphysis. (g) Transverse section as indicated in (e) and (f). (h) Magnification of counter-stained transverse section of the region indicated in (g). (i) Particular of counter-stained transverse section as indicated in (e) and (f). Black arrowhead indicates cell cluster probably representing either the telencephalic migrated area or the migrated entopeduncular complex. Blue arrowhead indicates cells in the habenular region. E, epihysis; DT, dorsal thalamus; Ha, habenula; P, pallium; TeO, optic tectum; TVe, telencephalic ventricle. |
| Gene: | |
|---|---|
| Fish: | |
| Anatomical Terms: | |
| Stage: | Day 4 |