
Fig. S5
- ID
- ZDB-FIG-150312-35
- Publication
- Junker et al., 2014 - Genome-wide RNA Tomography in the Zebrafish Embryo
- Other Figures
- All Figure Page
- Back to All Figure Page
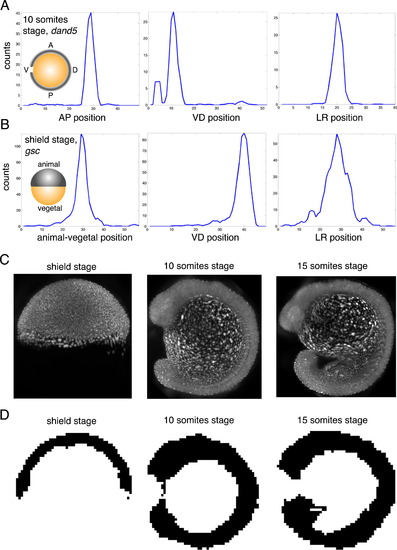
Selective Plane Illumination Microscopy Allows Measuring the Shape of Embryos in 3D, Related to >Figure 5 (A) Expression patterns for dand5 at 10 somites stage along AP, VD and LR axis. (B) Expression patterns for gsc at shield stage along animal-vegetal, VD and LR axis. (C) SPIM data for Tg(h2afva:h2afva-mCherry) zebrafish embryos at shield stage, 10 somites stage, and 15 somites stage. Images show projections along LR axis. (D) 3D mask of zebrafish embryo at 3 stages (binary images created by aligning SPIM data for 3 different embryos). Images show single plane perpendicular to LR axis through the middle of the embryo. |
Reprinted from Cell, 159, Junker, J.P., Noël, E.S., Guryev, V., Peterson, K.A., Shah, G., Huisken, J., McMahon, A.P., Berezikov, E., Bakkers, J., van Oudenaarden, A., Genome-wide RNA Tomography in the Zebrafish Embryo, 662-75, Copyright (2014) with permission from Elsevier. Full text @ Cell