
Fig. 4
- ID
- ZDB-FIG-150130-11
- Publication
- Essers et al., 2014 - A comparative study of nucleostemin family members in zebrafish reveals specific roles in ribosome biogenesis
- Other Figures
- All Figure Page
- Back to All Figure Page
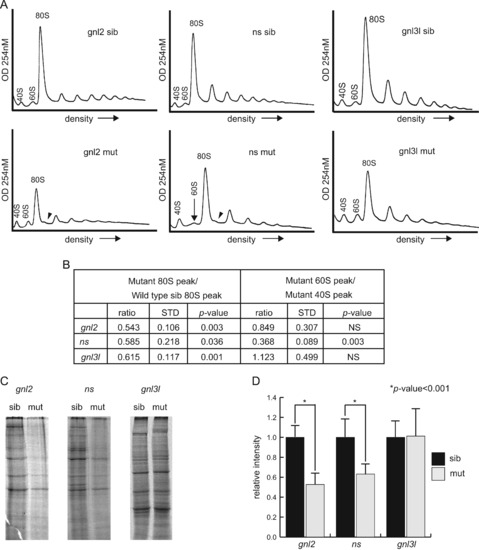
Polysome profiles reveal different effects of the mutations on ribosome biogenesis. (A) Polysome profiles of gnl2, ns and gnl3l mutants at 2 dpf. Location of the small (40S) and large (60S) subunits, as well as the monosome (80S) and halfmers (arrowheads) are indicated. The arrow indicates the collapsed 60S peak in the ns mutants. Results are representative of at least three independent experiments (shown in Fig. S1). (B) Quantification of peak sizes including profiles in Fig. S1. The ratios of the size of the mutant 80S peak to the wild type sibling 80S peak are shown on the left. The ratio of the mutant 60S peaks to the mutant 40S peaks are shown on the right. STD=standard deviation, NS=not significant. (C) Representative exposures of 35S-radiolabeled total protein synthesized in a 30-minute pulse in embryonic cells. (D) Quantifications of whole lane intensity in at least 3 samples (11 samples for gnl3l experiments). p<0.01 by Student′s two-tailed t-test. |
| Fish: | |
|---|---|
| Observed In: | |
| Stage: | Long-pec |
Reprinted from Developmental Biology, 385(2), Essers, P.B., Pereboom, T.C., Goos, Y.J., Paridaen, J.T., and Macinnes, A.W., A comparative study of nucleostemin family members in zebrafish reveals specific roles in ribosome biogenesis, 304-15, Copyright (2014) with permission from Elsevier. Full text @ Dev. Biol.