
Fig. S3
- ID
- ZDB-FIG-150115-39
- Publication
- Kizil et al., 2014 - Simplet/Fam53b is required for Wnt signal transduction by regulating β-catenin nuclear localization
- Other Figures
- All Figure Page
- Back to All Figure Page
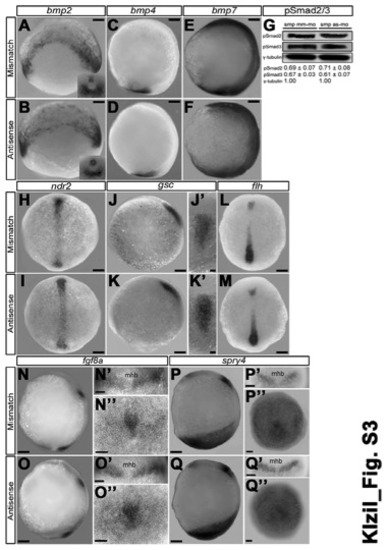
Loss of smp activity does not affect Bmp, Nodal or Fgf signaling, Related to Figures 1,4. (A) bmp2 expression in the marginal cells and the tailbud (insert) of mismatchmorpholino controls. (B) bmp2 expression in smp morphants (Antisense) shows similar expression as controls at tailbud stage. (C) bmp4 at the tailbud stage is located in the posterior tailbud. (D) bmp2 expression in smp morphants is similar to controls. (E) bmp7 expressed throughout the tailbud-staged embryo of mismatch controls. (F) smp morphants show similar bmp7 expression. (G) qRT-PCR comparing the relative levels of Np63 expression between MM control and smp morphants. (H) Dorsal view of ndr2 (nodal related 2) expression in the prechordal plate of control embryos at tailbud stage. (I) Dorsal view ndr2 expression in smp morphants. (J) Lateral view of goosecoid (gsc) expression in controls at tailbud stage. (J′) Dorsal view of gsc in controls. (K) Lateral view of gsc expression in smp morphants. (K′) Dorsal view of gsc expression in smp morphants. (L) Dorsal view of floating head (flh) expression the prechordal plate of controls. (M) Dorsal view of flh expression in smp morphants. (N) Lateral view of fgf8a expression in controls show expression in midbrainhindbrain boudary, and the mesendoderm of the tailbud. (N′) Dorsal view of fgf8a expression in midbrain-hindbrain of controls. (N′′) Posterior view of fgf8a expression in tailbud of controls. (O) Lateral view of fgf8a expression in smp morphants. (O′) Dorsal view of fgf8a expression in smp morphants. (O′′) Posterior view of fgf8a expression in smp morphants. (P) Lateral view of spry4 expression in controls showing midbrain-hindbrain expression and posterior expression. (P′) Dorsal view of spry4 expression in midbrain-hindbrain of controls. (P′′) Posterior view of spry4 expression in controls. (Q) Lateral view of spry4 expression in smp morphants. (Q′) Dorsal view of spry4 expression smp morphants. (Q′′) Posterior view of spry4 expression in smp morphants. Lateral views: A-F, J, K, N-Q; elsewhere dorsal (H, I, L, M), anterior (N′-Q′) or tailbud (N′′-Q′′) views. Numbers in the lower left corners in panels indicate the number of embryos with the depicted expression patterns to the total number of embryos. Scale bars: 100 μm (A-K,L-N,O,P,Q) and 50 μm elsewhere. Numbers below the Western blot bands indicate relative normalized abundance values. |