|
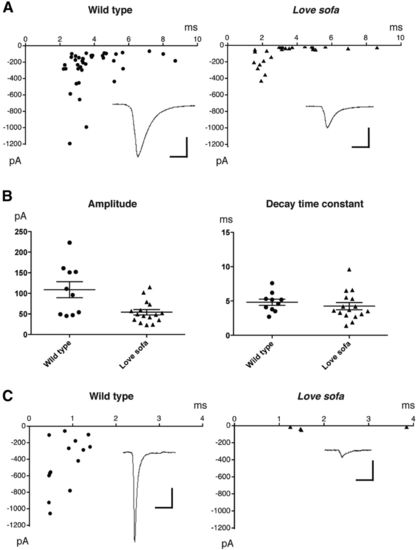
AChR functions in slow and fast fibers of the love sofa mutant. A, Decay time constants (x) plotted against current peak amplitudes (y) for mEPCs in a slow muscle of wild-type (left) or love sofa (right). Averaged traces for all mEPCs are shown as insets. Calibration: 100 pA, 5 ms. B, Accumulated data of current amplitudes and decay time constants recorded from slow muscle cells. Each dot represents an average for a single cell. Averages with SEs are shown. C, Decay time constants (x) plotted against current peak amplitudes (y) for mEPCs in fast muscle cells of wild-type (left) and love sofa (right). Averaged traces are shown as insets. Calibration: 100 pA, 5 ms.
|