
Fig. 3
- ID
- ZDB-FIG-141028-3
- Publication
- Mich et al., 2014 - In vivo imaging of hedgehog pathway activation with a nuclear fluorescent reporter
- Other Figures
- All Figure Page
- Back to All Figure Page
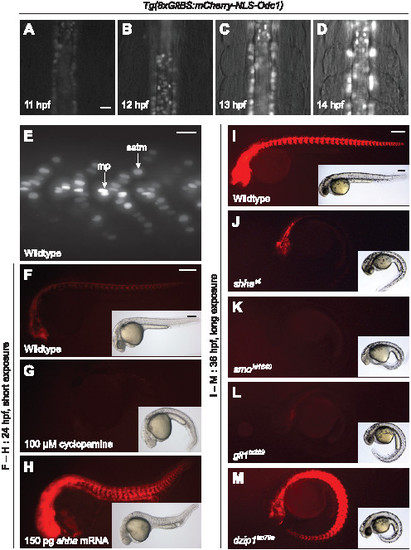
Tg(8xGliBS:mCherry-NLS-Odc1) zebrafish report Hh pathway activity with high sensitivity and fidelity. (A–D) Videomicroscopy frames of a Tg(8xGliBS:mCherry-NLS-Odc1) embryo during early somitogenesis. (E) Somitic region of a Tg(8xGliBS:mCherry-NLS-Odc1) zebrafish at 24 hpf, revealing cellular differences in nuclear mCherry fluorescence. Muscle pioneer cells (mp) and superficial slow-twitch muscle fibers (sstm) are labeled. (F–H) Tg(8xGliBS:mCherry-NLS-Odc1) zebrafish treated with cyclopamine or shha mRNA at the one-cell stage. Fluorescence and brightfield images of representative 24-hpf embryos are shown. (I–M) Tg(8xGliBS:mCherry-NLS-Odc1) zebrafish in wildtype or the indicated mutant backgrounds. Fluorescence and brightfield images of representative 36-hpf embryos are shown. The fluorescence micrographs were acquired with longer exposure times than those in panels F–H to enable the detection of low-level reporter activity. Brightfield micrographs show the distinctive you-type phenotypes observed within the same clutch of embryos. Embryo orientations: A–D, dorsal view and anterior up; E–M, lateral view and anterior left. Scale bars: A–E, 20 μm; F–M, 200 μm. |