
Fig. 3
- ID
- ZDB-FIG-141024-3
- Publication
- Zdebik et al., 2013 - Epilepsy in kcnj10 Morphant Zebrafish Assessed with a Novel Method for Long-Term EEG Recordings
- Other Figures
- All Figure Page
- Back to All Figure Page
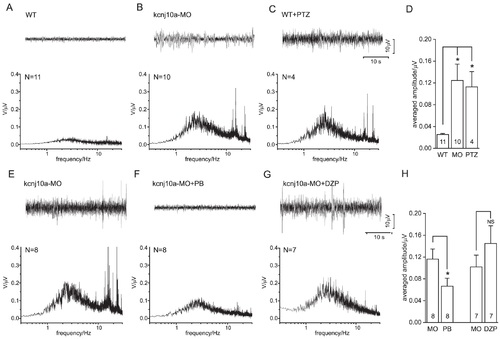
Analysis of surface EEGs. (A-C) Original traces (top) and averaged frequency spectra (below) obtained in WT ZF, kcnj10a morphant ZF and WT ZF pretreated with pentylenetetrazol. (D) The averaged amplitudes (mean over 2-4 Hz) from (A-C) are compared. Note the significant epileptic activity in kcnj10a morphant (MO) and pentylenetetrazol-treated (PTZ) ZF. (E-G) Original traces (top) and averaged frequency spectra (below) obtained in kcnj10a morphant fish, and kcnj10a morphants treated with pentobarbitone (PB) or diazepam (DZP), respectively. (H) Averaged amplitudes (mean over 2-4 Hz) from (E-G) are compared. Note the significant suppression of epileptic activity by PB treatment, and lack of suppression by DZP. |
| Fish: | |
|---|---|
| Condition: | |
| Knockdown Reagent: | |
| Observed In: | |
| Stage: | Day 5 |