
Fig. 3
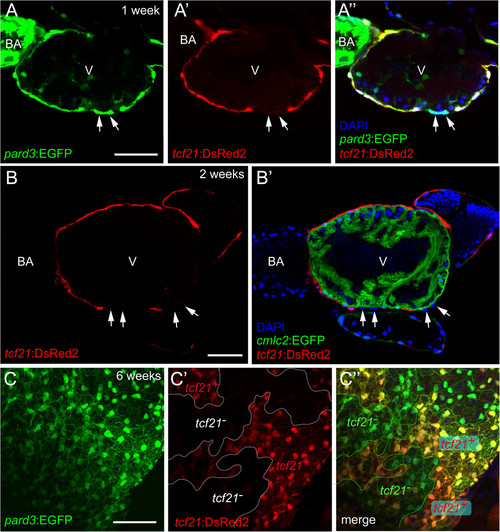
Heterogeneous tcf21 expression within the developing epicardium. Confocal images of the developing zebrafish epicardium. (A-A”) Lateral view of a 1-week pard3:EGFP; tcf21:DsRed2 heart (n = 10). (A) Epicardial cells are marked with pard3:EGFP (green). (A′) Immunostaining for DsRed2 (red). (A”) Merge of A and A′ with DAPI staining (nuclei; blue). Arrows indicate pard3+/tcf21- epicardial cells. (B-B′) Ventral view of a 2-week cmlc2:EGFP; tcf21:DsRed2 heart (n = 5). (B) Epicardial cells are marked with immunostaining for DsRed2 (red). (B′) cmlc2:EGFP; tcf21:DsRed2 heart with DAPI staining (nuclei; blue). tcf21-/DAPI + epicardial cells (arrows) are seen overlying the myocardium. (C-C”) Ventricular epicardium from a 6-week old zebrafish heart (n = 5). (C) Epicardial cells are marked with pard3:EGFP (green). (C′) Immunostaining for DsRed2 (red). (C”) Merge of C and C′. For all panels: V is ventricle, BA is bulbus arteriosus. Scale bars = 50 microns. |