
FIGURE
Fig. 3
- ID
- ZDB-FIG-140902-7
- Publication
- Chen et al., 2014 - Developmental Toxicity of Diclofenac and Elucidation of Gene Regulation in zebrafish (Danio rerio)
- Other Figures
- All Figure Page
- Back to All Figure Page
Fig. 3
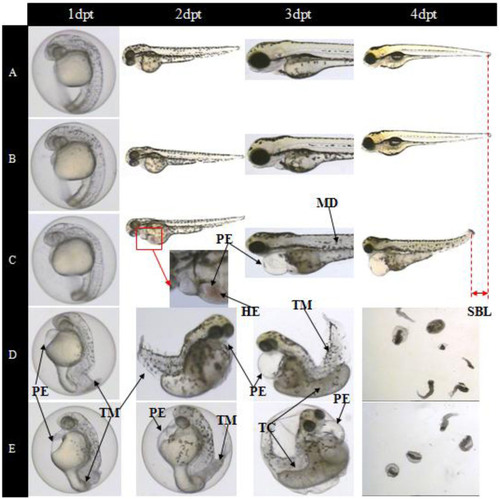
(A) Control group; (B) 1.01μM exposure group; (C) 3.38μM exposure group; (D) 10.13μM exposure group; (E) 15.2μM exposure group. HE: hemagglutination, MD: muscle degeneration, PE: pericardial edema, SBL: short body length, TC: trunk curvature, TM: tail malformation. |
Expression Data
Expression Detail
Antibody Labeling
Phenotype Data
Phenotype Detail
Acknowledgments
This image is the copyrighted work of the attributed author or publisher, and
ZFIN has permission only to display this image to its users.
Additional permissions should be obtained from the applicable author or publisher of the image.
Full text @ Sci. Rep.