
Fig. 3
- ID
- ZDB-FIG-140512-39
- Publication
- Jetti et al., 2014 - Spontaneous activity governs olfactory representations in spatially organized habenular microcircuits
- Other Figures
- All Figure Page
- Back to All Figure Page
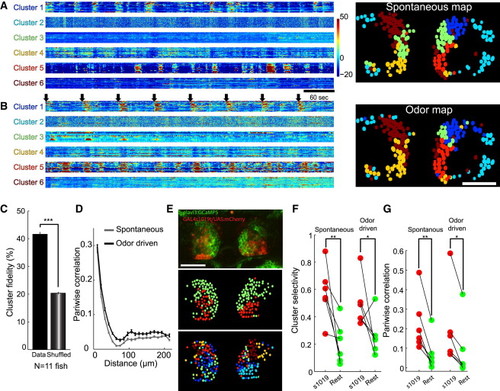
Spontaneous Activity in the Dorsal Habenula Is Structured into Functionally, Spatially, and Genetically Distinct Microcircuits that Govern Odor Responses (A and B) Spontaneous (A) and food-odor-evoked (B) activity of dHb neurons (y axis) are clustered using k-means clustering (left). Arrows indicate food-odor delivery. Spatial positions of dHb neurons in each cluster are marked with the corresponding cluster color (right). Scale bars represent 50 μm. (C) A significant portion of dHb neurons remained within the same functional cluster during spontaneous and odor-evoked activity (n = 11). This is higher than chance (rank-sum test, p < 0.0005). (D) Pairwise correlation of spontaneous and odor-evoked activity versus distance between dHb neurons. (E) elavl3:GCaMP5;GAL4s1019t/UAS:mCherry zebrafish dHb (top). The GAL4s1019t/UAS:mCherry neurons (red) are identified among other (green) dHb neurons (middle). Functional clusters in the dHb based on k-means clustering are shown (bottom). Note that the red neurons overlap with the cyan and blue functional clusters. (F and G) GAL4s1019t neurons (red) are represented by significantly fewer clusters (F) and have more correlated spontaneous and odor-evoked activity (G) than the remaining green neurons (n = 6; properties of red and green neurons in each fish are represented by one green and red circle connected by a line). Paired t test, p < 0.05, p < 0.005. See also Figures S6 and S7. |