
Fig. 2
- ID
- ZDB-FIG-140512-38
- Publication
- Jetti et al., 2014 - Spontaneous activity governs olfactory representations in spatially organized habenular microcircuits
- Other Figures
- All Figure Page
- Back to All Figure Page
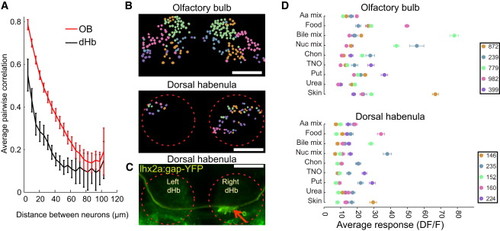
Spatial Organization of Odor Responses in the Olfactory Bulb and Dorsal Habenula (A) Relation between pairwise similarity of individual neurons odor responses and distance between OB and dHb neurons in microns. (B) Spatial distribution of neurons with similar response profiles in the OB and dHb. The neurons are grouped and colored on the basis of k-means clustering. (C) MC axon terminals (yellow) in the dHb of lhx2a:gap-YFP zebrafish (arrow). (B and C) Dotted red lines indicate the borders of the habenula. Scale bars represent 50 μm. (D) Average odor responses of all neural clusters in the OB and dHb. Each color corresponds to a cluster of neurons with similar odor responses, which also corresponds to the clusters of neurons in (B). Legends represent the number of neurons in different clusters. Error bars represent the SEM for the odor responses of neurons in each cluster. Note that the average cluster responses of OB neurons are stronger than the average cluster responses in the dHb. See also Figures S4 and S5. |