
Fig. 4
- ID
- ZDB-FIG-140506-49
- Publication
- Pavlou et al., 2014 - Pleiotropic effects of Sox2 during the development of the zebrafish epithalamus
- Other Figures
- All Figure Page
- Back to All Figure Page
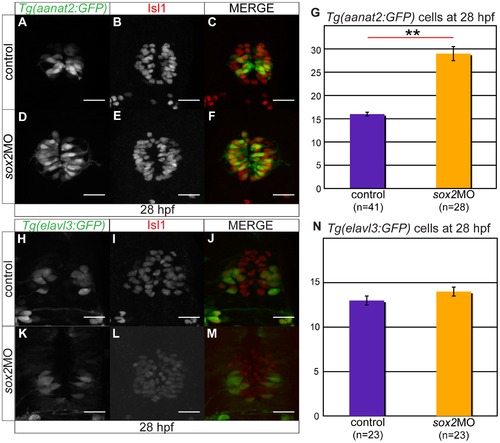
C) Tg(aanat2:GFP) drives GFP expression in the pineal PhRs. (B) Isl1 labels the pineal cells. (D–F) Knockdown of sox2 results in increased number of PhRs. (G) The average number of PhRs in control (purple bar) and sox2 morphants (orange bar). (H–J) Tg(elavl3:GFP) drives GFP expression specifically in the PNs. (K–M) The knockdown of sox2 does not affect the number of PNs. (N) The average number of PNs in controls (purple bar) and sox2 morphants (orange bar) does not significantly differ. Confocal maximum projections of 28 hpf embryos, scale bars = 25 μm, error bars represent ± standard error, ** = p-value <0.001 (MWU test). See also Figure S4. |
| Gene: | |
|---|---|
| Antibody: | |
| Fish: | |
| Knockdown Reagent: | |
| Anatomical Terms: | |
| Stage: | Prim-5 |
| Fish: | |
|---|---|
| Knockdown Reagent: | |
| Observed In: | |
| Stage: | Prim-5 |