
Fig. 3
- ID
- ZDB-FIG-140324-16
- Publication
- Wang et al., 2013 - Impact of a combined high cholesterol diet and high glucose environment on vasculature
- Other Figures
- All Figure Page
- Back to All Figure Page
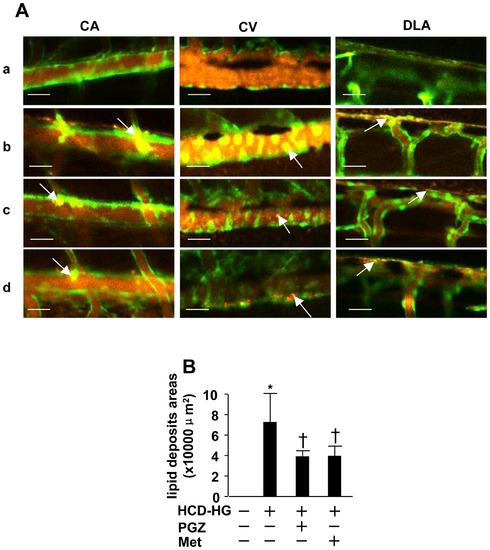
Lipid accumulation in vasculature. A: Apparent lipid accumulation (yellow) was observed. (a), (b), (c), (d) panels respectively show lipid deposits in different experimental groups. (a) Control group; (b) HCD-HG group; (c) Pioglitazone treatment group; (d) Metformin treatment group. White arrows point out the locations of lipid deposits. Scale bar = 40 μm. B: Areas of the lipid accumulation were selected as the region of interest (ROI), and estimated by measuring the dimension of ROI. Using the Student t test, we found that the amount of lipid accumulation was significantly larger in the HCD-HG treated group than that in the control group (p<0.05). The addition of pioglitazone or metformin significantly reduced the lipid accumulation (p<0.05). Asterisk (*): Comparison of lipid accumulation between control group and HCD-HG group. Cross (†): Comparison of lipid accumulation between HCD-HG group and drug treatment groups, respectively. |