
Fig. 2
- ID
- ZDB-FIG-140324-15
- Publication
- Wang et al., 2013 - Impact of a combined high cholesterol diet and high glucose environment on vasculature
- Other Figures
- All Figure Page
- Back to All Figure Page
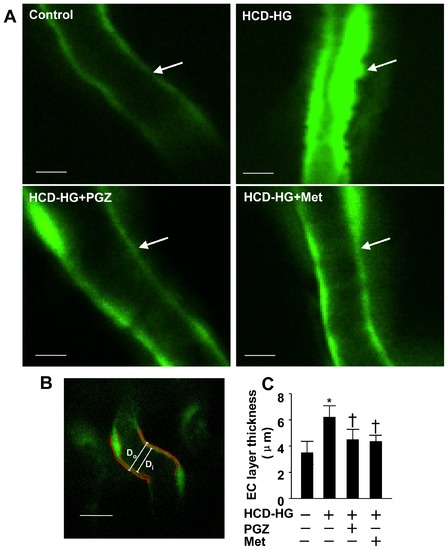
Endothelial layer thickening of optical vessels in HCD-HG treatment group. A: Different treatments led to changes of endothelial layer in optical arteries. Transgenic zebrafish (Fli1:EGFP) larvae were imaged in a lateral position by confocal microscope, and emission wavelength of 488 nm was detected. Scale bar = 10 μm. B: Endothelial layer thickness (T) was measured by subtracting inner diameter (Di) from outer diameter (Do), T = (Do-Di)/2. Changes in the thickness of endothelial layer were quantified and presented as mean ±SD. Scale bar = 20 μm. C: Pioglitazone and metformin effectively prevented the endothelial layer from becoming thick afer HCD-HG treatment. N = 11 in the control group, N = 24 in the HCD-HG group, N = 10 in HCD-HG+ pioglitazone group, N = 18 in HCD-HG+ metformin group. PGZ: pioglitazone; Met: metformin. Asterisk (*): Comparison of EC layer thickness between control group and HCD-HG group (p<0.05). Cross (†): Comparison of EC layer thickness between control and drugs treatment groups (p<0.05). |
| Gene: | |
|---|---|
| Fish: | |
| Conditions: | |
| Anatomical Term: | |
| Stage: | Days 14-20 |
| Fish: | |
|---|---|
| Conditions: | |
| Observed In: | |
| Stage: | Days 14-20 |