
Fig. 4
- ID
- ZDB-FIG-131205-25
- Publication
- Tsedensodnom et al., 2013 - Ethanol metabolism and oxidative stress are required for unfolded protein response activation and steatosis in zebrafish with alcoholic liver disease
- Other Figures
- All Figure Page
- Back to All Figure Page
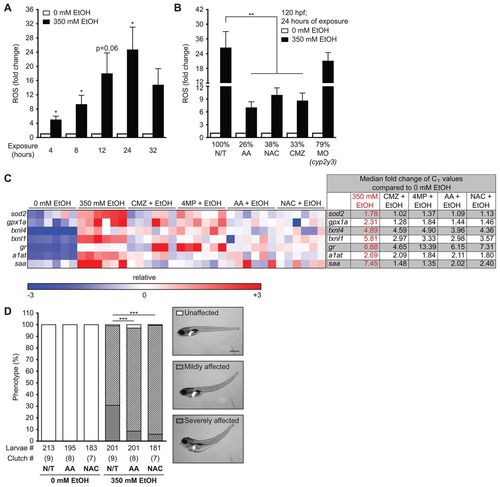
Ethanol-induced ROS production and morphological abnormalities in zebrafish are rescued by antioxidants and inhibitors of ethanol metabolism. (A) ROS production was measured by assaying CM-H2DCFDA fluorescence in the media during exposure to 350 mM ethanol. The arbitrary units of fluorescence measured in duplicate from larvae treated with 350 mM ethanol were normalized to corresponding untreated fish and the average fold changes of four clutches are shown. *P<0.05 as determined by a one-sample Student’s t-test. (B) Larvae were either pre-treated with 125 μM AA, 20 μM NAC or 100 μM CMZ at 94 hpf or injected with 4–6 nl of 0.1 mM cyp2y3 morpholino at 0 hpf and then exposed to 350 mM ethanol at 96 hpf for 24 hours. **P<0.01 by one-way ANOVA and Tukey’s post-hoc test. (C) A heatmap of relative expression based on qPCR from cDNA isolated from the livers of larvae exposed to 350 mM ethanol alone or co-treated with CMZ, 4MP, AA or NAC for 24 hours. Each row is a gene and each column is a single clutch, and the color range (red – high, blue – low) was determined via the median method in GENE-E. CMZ, 4MP, AA and NAC treatments alone did not affect the expression of these genes when compared with untreated larvae (0 mM) and thus are not shown. The fold changes of the median CT values of six clutches are shown to the right and individual CT values are in supplementary material Table S2. The median was calculated for each row (gene) and subtracted from each data point. All six clutches are aligned according to the order of the lowest (blue) to the highest (red) expression of sod2 in 350 mM ethanol treatment. (D) Representative images of unaffected, and mildly or severely affected larvae are shown on the right. The phenotypes were scored in an average of nine clutches (n=210 larvae per cohort). ***P<0.001 refers to severely affected fish (gray bars) and was calculated by one-way ANOVA and Tukey’s post-hoc test. |