
Fig. 3
- ID
- ZDB-FIG-131205-24
- Publication
- Tsedensodnom et al., 2013 - Ethanol metabolism and oxidative stress are required for unfolded protein response activation and steatosis in zebrafish with alcoholic liver disease
- Other Figures
- All Figure Page
- Back to All Figure Page
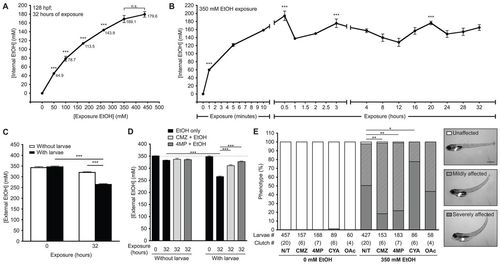
Ethanol is rapidly internalized, utilized and metabolized in zebrafish larvae. (A) Internal ethanol concentration was measured in homogenates of whole larvae treated with the indicated ethanol concentrations at 96–128 hpf. Values are in mM; mean ± s.e.m. n=6 clutches, n=260 larvae. All concentration points are statistically significant (***P<0.001) from the controls. Samples labeled as n.s. did not differ from one another. (B) Internal ethanol concentration determined from whole larvae treated with 350 mM ethanol for the indicated durations; mean ± s.e.m. n=6 clutches, n=200 larvae. All time points on the curve are significantly different (P<0.001) from t=0. ***P<0.001 versus t=32 hours. (C) Ethanol internalization and consumption was measured by calculating the external (water) ethanol concentration at t=0 and t=32 hours of larval exposure. To account for ethanol evaporation, concentration was also calculated from media that lacked larvae and was maintained in parallel. Values are the average of triplicate measurements of samples obtained from four clutches (mean ± s.e.m.); ***P<0.001. (D) The effects of CMZ and 4MP on ethanol utilization was measured in naïve larvae (black bars) or larvae pre-treated with 100 μM CMZ (light gray) or 1 mM 4MP (dark gray) at 94 hpf and then co-exposed to 350 mM ethanol from 96 to 128 hpf at a density of 1 larva/ml. Dashed line marks 350 mM ethanol. Values were calculated from triplicate measurements on three clutches (mean ± s.e.m.). ***P<0.001. (E) Untreated larvae (N/T) and larvae pre-treated with 100 μM CMZ, 1 mM 4MP, 3 mM CYA or 40 mM OAc at 94 hpf and then co-exposed with one of these drugs and 350 mM ethanol from 96 to 120 hpf were scored for mild or severe phenotypes, as shown in the representative images in the panels on the right. The severely affected phenotype (gray bars) was significantly reduced in larvae co-treated with CMZ or 4MP, but increased with CYA. *P<0.05 and **P<0.01. Statistics in all panels were calculated by one-way ANOVA and Tukey’s post-hoc test. |