
Fig. 1
- ID
- ZDB-FIG-131205-22
- Publication
- Tsedensodnom et al., 2013 - Ethanol metabolism and oxidative stress are required for unfolded protein response activation and steatosis in zebrafish with alcoholic liver disease
- Other Figures
- All Figure Page
- Back to All Figure Page
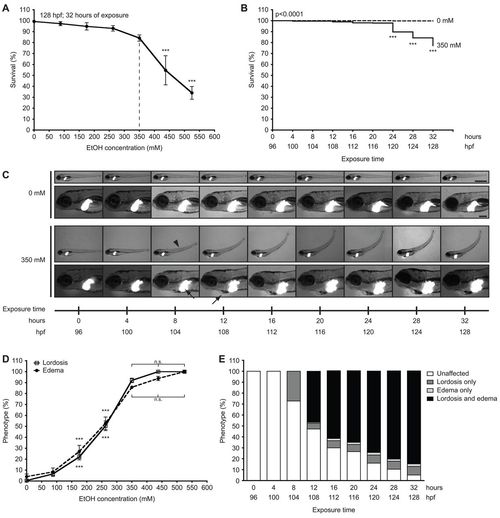
Concentrations of ethanol exceeding 350 mM reduce survival and induce multisystemic morphological abnormalities in 4 dpf larvae. (A) Larvae at 96 hpf were exposed to 0 mM, 87.5 mM (0.5%), 175 mM (1.0%), 262.5 mM (1.5%), 350 mM (2.0%), 437.5 mM (2.5%) and 525 mM (3.0%) ethanol and scored for viability at 128 hpf; mean ± s.e.m. n=6 clutches, n=125 larvae per treatment; ***P<0.001 versus 0 mM. The dashed line indicates the optimal concentration. (B) Kaplan-Meier survival curve of larvae exposed to 0 mM or 350 mM ethanol for 32 hours and scored for survival at every 4 hours; n=13 clutches, n=562 larvae per cohort. The P-value is indicated as determined by log-rank test; ***P<0.001 versus 96 hpf in 350 mM curve. (C) Images of one Tg(fabp10:dsRed) larva during exposure to 0 mM ethanol and another during exposure to 350 mM ethanol from 96 to 128 hpf. Arrowhead indicates lordosis at 104 hpf; arrows indicate hepatomegaly at 104 hpf and pericardial edema at 108 hpf. Scale bars: 1 mm in the upper panels and 0.2 mm in the lower panels. (D) Lordosis and edema were scored in larvae that survived 32-hour exposure to ethanol at concentrations of 0–525 mM; mean ± s.e.m. n=6 clutches, n=100 larvae. Except for the 87.5 mM ethanol group, all concentration points on both curves are significantly different (***P<0.001) compared with 0 mM. There is no significant (n.s.) difference in the percent of lordosis and edema in larvae treated with 350 mM ethanol or greater. (E) Morphological changes during 32 hours of exposure to 350 mM ethanol were averaged from ten clutches (n=442 per group). The percent of unaffected larvae was significantly reduced at all time points starting at 8 hours of exposure; the percent of larvae with lordosis alone was significantly increased from 8 hours of exposure; and the percent of larvae with both lordosis and edema was significantly increased at 12 hours of exposure and later; P<0.001. Untreated larvae (n=442) scored in parallel did not display any of these phenotypes at any time points (not shown). All statistical significance, except where indicated, was calculated by one-way ANOVA and Tukey’s post-hoc test. |
| Fish: | |
|---|---|
| Condition: | |
| Observed In: | |
| Stage: | Day 4 |