
Fig. 7
- ID
- ZDB-FIG-131121-2
- Publication
- Fries et al., 2013 - Zebrafish guanylate cyclase type 3 signaling in cone photoreceptors
- Other Figures
- All Figure Page
- Back to All Figure Page
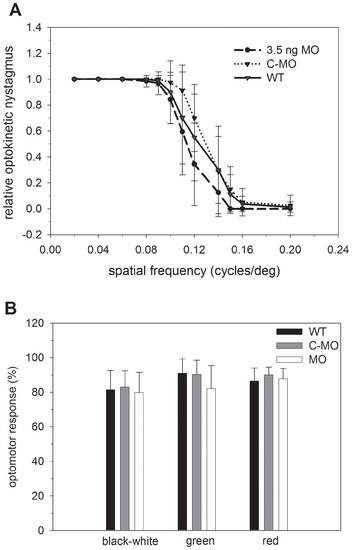
Visual behavioral assays. (A) Optokinetic response measurements of WT, MO and control MO larvae: 8-10 larvae at 5 dpf were investigated by presenting stimuli of a pattern of black and white stripes as described in the Methods. Results of black and green, black and red, and black and blue striped pattern are shown in supplementary Fig. S1. The relative optokinetic nystagmus is shown as a function of the spatial frequency (mean±s.d.). (B) Optomotor response evaluation of larvae as indicated at 6 dpf. For the black and white stimulus the mean±s.d. of 52 measurements is shown (MO versus WT: t = 0.98, Pe0.05; MO versus control MO: t = 2.0, P = 0.05; control MO versus WT: t = 1.05, P≥0.05), for the coloured stimuli the mean±s.d. of 12 data sets each is shown (black/green MO versus WT: t = 1.94, P e 0.05; MO versus control MO: t = 1.8, P≥0.05; control MO versus WT: t = 0.19, P≥0.05). Black / red: MO versus WT: t = 0.44, P≥0.05; MO versus control MO: t = 1.05, P≥0.05; control MO versus WT: t = 1.4, P≥0.05). |
| Fish: | |
|---|---|
| Knockdown Reagent: | |
| Observed In: | |
| Stage: | Day 5 |