
Fig. S1
- ID
- ZDB-FIG-131101-16
- Publication
- Burkhalter et al., 2013 - Grk5l Controls Heart Development by Limiting mTOR Signaling during Symmetry Breaking
- Other Figures
- All Figure Page
- Back to All Figure Page
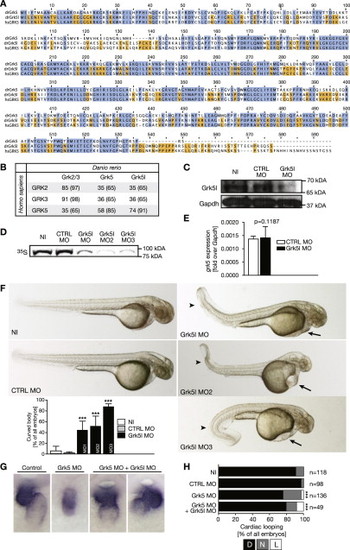
Grk5l Is the Closer Homolog of Human GRK5, Related to Figure 1 (A) Multiple protein sequence alignment of both zebrafish Grk5 variants to human GRK5 (CAI15804.1) indicates that Grk5l (OTTDARP00000028829) is the variant with more homology to human GRK5. Amino acids conserved between both zebrafish proteins and human GRK5 are colored in blue. Residues identical between zebrafish Grk5 (OTTDARP00000033957) and human GRK5 are indicated in light blue, whereas those conserved between Grk5l and its human homolog are marked in orange. drGrk5, danio rerio Grk5; drGrk5l, danio rerio Grk5l; hsGRK5, Homo sapiens GRK5. (B) Table displaying the percentage of amino acids identical or similar (in brackets) between zebrafish and human GRKs. Human GRK2 (NP_001610.2), zebrafish Grk2/3 (ACH56535.1). (C) Western blot of whole embryo lysates (24 hpf). Zebrafish were left either uninjected (NI) or were control injected (CTRL MO) or injected with a translation blocking MO (Grk5l MO). Probing with an anti-GRK5 antibody revealed a decrease in Grk5l protein in morphant embryos. Gapdh was used as loading control. (D) Autoradiogram showing the binding efficiency of the Grk5l MO 1, 2 and 3. In vitro translation of GFP-tagged Grk5l was performed in the presence of CTRL and translation blocking MOs using a cell-free reticulocyte lysate and 35S-labeled methionine for detection. As template, pCS2+GFP containing parts of the 52UTR fused to the ORF of Grk5l was used. (E) Knockdown of Grk5l does not affect grk5 levels in zebrafish embryos. Bar graph displays relative levels of grk5 normalized to gapdh as mean ± SEM n = 4-6. p = 0.45, two-tailed t test. (F) Live images of 48 hpf embryos, which were left uninjected (NI) or were injected with either CTRL MO, Grk5l MO, GRK5l MO2 or Grk5l MO3 at the one cell stage. Arrows indicate pericardiac edema developing in Grk5l morphants. Arrowheads point toward curled tails, which can be an indication of a ciliary defect. Bar graph summarizes 3 to 8 experiments and displays as means ± SEM. Grk5 CTRL MO versus Grk5l MO: p < 0.0001, two-tailed t test, Grk5 CTRL MO versus Grk5l MO2: p < 0.0001, one-tailed t test, Grk5 CTRL MO versus Grk5l MO3: p < 0.0001, one-tailed t test. n = 76 to 274 embryos in total. (G) Heart looping is also disturbed when Grk5 alone or along with Grk5l is knocked down. WMISH for cmlc2. CTRL MO here describes a five-base mismatch MO for Grk5. (H) Bar graph summarizing heart looping experiments as shown in (F). D, D-loop, N, no loop, L, L-loop. Grk5 CTRL MO versus Grk5 MO: p < 0.0001, Grk5 CTRL MO versus Grk5 MO combined with Grk5l MO: p = 0.0002; Fisher’s exact test. |
| Genes: | |
|---|---|
| Fish: | |
| Knockdown Reagents: | |
| Anatomical Terms: | |
| Stage Range: | Prim-5 to Long-pec |
| Fish: | |
|---|---|
| Knockdown Reagents: | |
| Observed In: | |
| Stage: | Long-pec |