
FIGURE
Fig. S1
Fig. S1
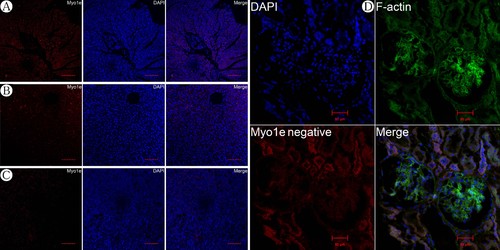
Myo1e expression in Heart (A), Liver (B) and Spleen (C) tissues (scale bar 100μm). D. For negative control by adding secondary antibody only in Myo1e staining in glomerular samples. |
Expression Data
Expression Detail
Antibody Labeling
Phenotype Data
Phenotype Detail
Acknowledgments
This image is the copyrighted work of the attributed author or publisher, and
ZFIN has permission only to display this image to its users.
Additional permissions should be obtained from the applicable author or publisher of the image.
Full text @ PLoS One