
FIGURE
Fig. 6
Fig. 6
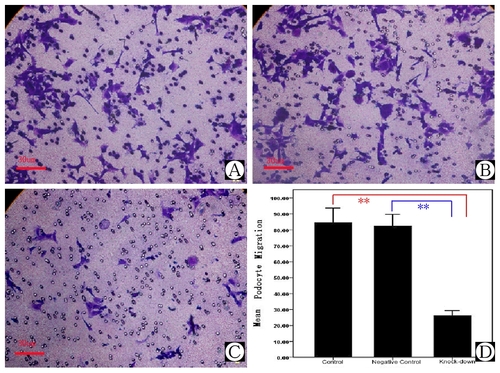
Migration assay of Myo1e depleted podocytes. A) Podocyte migration in control group. B) Podocyte migration in scrambled negative control group. C) Podocyte migration in MYO1E knock-down group. D) Comparison of mean migration effects of podocytes in different groups. **Compared with the results of control and negative control group, podocyte migration in the MYO1E knock-down group was down-regulated, P<0.01. |
Expression Data
Expression Detail
Antibody Labeling
Phenotype Data
Phenotype Detail
Acknowledgments
This image is the copyrighted work of the attributed author or publisher, and
ZFIN has permission only to display this image to its users.
Additional permissions should be obtained from the applicable author or publisher of the image.
Full text @ PLoS One