
Fig. 1
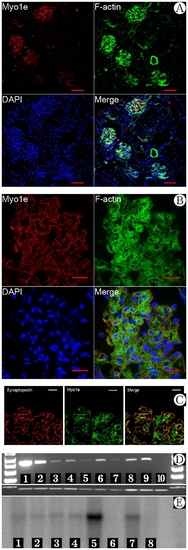
Expression of Myo1e in human and mouse tissues. A) Myo1e expression in normal human kidney. Scale bar: 100μm. B) Myo1e expression in normal human kidney. Scale bar: 20μm. C) Co-expression of synaptopodin and Myo1e in normal human podocytes observed by immunofluorescence and confocal microscope. Scale bar: 10μm. D) mRNA expression of Myo1e in multiple mouse tissues by RT-PCR. 1=purified glomeruli, 2=kidney without glomeruli, 3=lung, 4=brain, 5=testis, 6=spleen, 7=heart, 8=muscle, 9=total kidney, 10=β-actin. Myo1e was expressed abundantly in kidney (both in glomeruli and other tissue within the kidney) E) mRNA expression of Myo1e in multiple mouse tissues by Northern blot. 1=heart, 2=brain, 3=spleen, 4=lung, 5=liver, 6=muscle, 7=total kidney, 8=testis. |