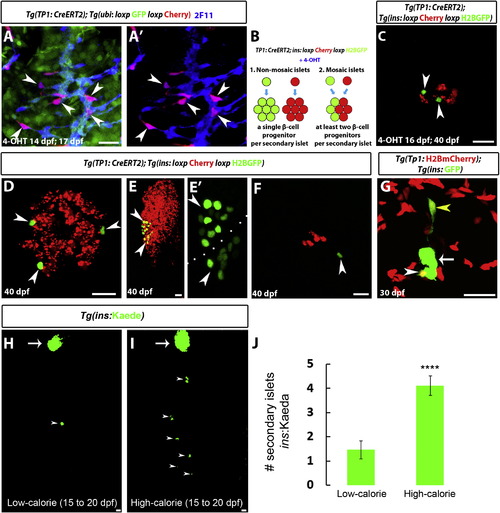
Nutrients Regulate β Cell Differentiation (A) Tg(TP1:CreERT2);Tg(ubi3C:loxp-GFP-loxp:mCherry) larvae were treated with 4-OHT at 14 dpf for 16 hr, fixed at 17 dpf, and stained for 2F11 to mark IPD cells. 4-OHT treatment resulted in the mosaic labeling of individual IPD cells (mCherry+;GFP cells) (arrowheads). (B) Experimental setup for the lineage tracing of β cells from IPD cells. Tg(insulin:loxP:mCherry-STOP:loxP:H2BGFP)+ β cells that originated from IPD cells with Tg(TP1:CreERT2) activity exhibit H2BGFP expression instead of mCherry expression. In a single-progenitor scenario (1), each SI would be composed of H2BGFP+ or mCherry+ cells, whereas, in a multiple-progenitor scenario (2), SIs would be mosaic, containing both H2BGFP+ and mCherry+ cells. (C–F) Tg(TP1:CreERT2);Tg(insulin:loxP:mCherry-STOP:loxP:H2BGFP) larvae treated with limiting concentrations of 4-OHT at 16 dpf for 16 hr and analyzed at 40 dpf. (C) A mosaic SI composed of H2BGFP+ (arrowheads) and mCherry+ β cells. (D) Three individual H2BGFP+ β cells (arrowheads) located in the periphery of a SI, suggesting that they originated from three different IPD cells. (E) A PI showing two peripheral H2BGFP+ groups of β cells (arrowheads), indicating several cell cycles after differentiation. (F) A single H2BGFP+ β cell (arrowhead) in proximity to an SI. Of 20 animals treated with 4-OHT, 15 contained lineage-traced cells, whereas no lineage-traced cells were observed in vehicle-treated controls (n = 7 animals, 80 SIs and 7 PIs). (G) Tg(TP1:H2BmCherry);Tg(ins:GFP) animals were examined at 30 dpf. A projection of several planes shows an SI (arrow). The white arrowhead points to a single β cell in the periphery of the SI. The yellow arrowhead points to a single β cell outside the SI, extending a long cellular process toward it. Both of these β cells exhibit higher levels of Tg(TP1:H2BmCherry) fluorescence in comparison to the rest of the β cells in the SI, suggesting that they recently differentiated and did not undergo proliferation. (H and I) Tg(ins:Kaede) animals were maintained on a low-calorie diet until 20 dpf (H) or switched to a high-calorie diet (I) from 15 to 20 dpf (see Experimental Procedures). Although there is only a single Tg(ins:Kaede)+ SI (arrowhead) posterior to the PI (arrow) in (H), multiple SIs (arrowheads) formed in (I). (J) Quantification of the number of SIs posterior to the PI (n = 17 animals for each group). The high-calorie diet induced the formation of more SIs in comparison to the low-calorie diet (****p < 0.0001). Error bars represent SEM, and scale bars represent 20 μm. See also Figure S2.
|
