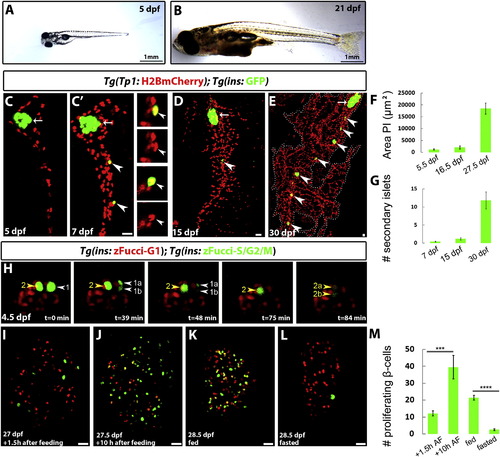
β Cells Transition from Quiescence to Proliferation in Response to Nutrients (A and B) Wild-type (WT) animals imaged at 5 (A) and 21 (B) dpf showing the dramatic growth that takes place in the feeding animal. (C–E) Tg(TP1:H2BmCherry);Tg(ins:GFP) larvae were examined with confocal imaging. Tg(TP1:H2BmCherry) drives the expression of H2BmCherry in NRCs in the IPD, and Tg(ins:GFP) labels β cells. Arrows point to the principal islet (PI). Arrowheads point to secondary islets (SI). (C and C′) The larva was imaged live at 5 (C) and at 7 (C′) dpf. At 7 dpf, two new β cells (arrowheads) had formed posterior to the PI. These cells derived from NRCs, given that they were also Tg(Tp1bglob:H2BmCherry)+. The insets show single planes with separated channels. At 7 dpf, 0.45 (±0.6, n = 21 larvae) β cells containing SIs per larva were present posterior to the PI. (D) At 15 dpf, the number β cells containing SIs per larva was 1.2 (±1.3, n = 22 larvae). (E) At 30 dpf, there was a dramatic increase in the number of β cells, which clustered in multiple SIs (11.8 ± 5.7 SIs per animal, n = 6 animals). The pancreas is outlined by a dashed line. (F) Quantification of the PI’s area at 5.5, 16.5 and 27.5 dpf, showing a dramatic increase in its size between 16.5 and 27.5 dpf (n = 6 animals at 5.5 and 16.5 dpf; 5 animals at 27.5 dpf). (G) Quantification of the number of Tg(ins:GFP)+ SIs at 7, 15, and 30 dpf showing a dramatic increase between 15–30 dpf (n = 22 animals at 7 and 15 dpf; 6 animals at 30 dpf). (H) Live imaging of a Tg(ins:zFucci-G1);Tg(ins:zFucci-S/G2/M) larva at 4.5 dpf. A projection of the stack is shown. At t = 0 min, two Tg(ins:zFucci-S/G2/M)+ β cells (arrowheads) were present in the PI. Both cells (1 and 2) divided during the course of the imaging, resulting in the downregulation and the subsequent loss of Tg(ins:zFucci-S/G2/M) expression in their daughter cells (1a and 1b and 2a and 2b, respectively). (I–L) Tg(ins:zFucci-G1);Tg(ins:zFucci-S/G2/M) animals were used to examine the effects of nutrients on β cell proliferation; the images show single confocal planes through the PI. (I–J) Animals from the same clutch were fixed at 1.5 (I) or 10 hr (J) after feeding (AF) starting at 27 dpf. Several β cells (12.2 ± 4.3 β cells, n = 9 animals) were proliferating 1.5 hr AF. (J) The number of proliferating β cells increased at 10 hr AF (39 ± 23 β cells, n = 11 animals, ***p < 0.005). (K) The animals were fed regularly and examined at 28.5 dpf (12 hr AF). Numerous β cells in the PI were proliferating (21.4 ± 4 β cells, n = 7 animals). (L) Animals from the same clutch as in (K) were deprived of food for 28 hr and examined at 28.5 dpf. The number of proliferating β cells in the PI was dramatically reduced (2.5 ± 2.2 β cells, n = 14 animals, ****p < 0.0001). (M) Quantification of the average number of proliferating β cells in the PI for the experiments shown in (I)–(L). (A), (B), and (H) are lateral views, anterior to the left and dorsal to the top; (C) and (D) are lateral views, anterior to the top and dorsal to the left; and (E) and (I)–(L) are dorsal views, anterior to the top. Error bars represent SEM, and scale bars represent 20 μm. See also Figure S1.
|
