FIGURE

Fig. 6

ID
ZDB-FIG-130326-67
Publication
Zhang et al., 2013 - The Role of egr1 in Early Zebrafish Retinogenesis
Other Figures
All Figure Page
Back to All Figure Page
Fig. 6

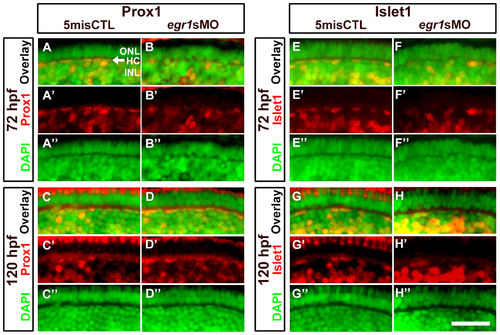
Immunohistochemical analysis of the HCs in the Egr1-morphant retinas.

A magnified view of the immunostaining results of HCs in the controls (5misCTLMO) and Egr1 morphants (egr1sMO) with Prox1 (A-D) and Islet1 (E-H) at 72 and 120 hpf. These selected regions correspond to the white boxes as shown in Figure 4. Prox1+ and Islet1+ cells are shown in red, while the DAPI nuclei counterstain is shown in green. The location of HCs is indicated by an arrow in A. See text, Table 1 and 2 for further discussion. In all pictures, the apical retina is to the top and dorsal is to the left. HC: horizontal cells; INL: inner nuclear layer; ONL: outer nuclear layer. Scale bar = 50 µm.

Expression Data
Antibodies:
Fish:
Knockdown Reagent:
Anatomical Term:
Stage Range: Protruding-mouth to Day 5

Expression Detail
Antibody Labeling
Phenotype Data
Fish:
Knockdown Reagent:
Observed In:
Stage Range: Protruding-mouth to Day 5

Phenotype Detail
Acknowledgments
This image is the copyrighted work of the attributed author or publisher, and ZFIN has permission only to display this image to its users. Additional permissions should be obtained from the applicable author or publisher of the image. Full text @ PLoS One