
Fig. 7
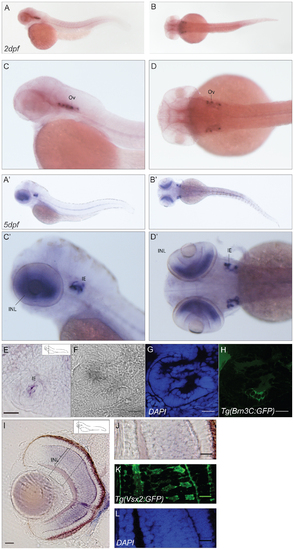
Expression pattern of cabp5b. (A–D2) Cabp5b expression in 2dpf (A–D) and 5dpf (A2–D2) zebrafish embryos: lateral (A,C–A2,C2) and dorsal (B,D–B2,D2) views. An intense staining is present in the inner ear and in the notochord at both stages of development. In 5dpf embryos, in addition, a strong signal is detectable in the retinal inner nuclear layer. (E–H) Sections of the ear in Tg(Brn3C:memGFP) transgenic line embryos. Epifluorescence image of a sectioned ear (E) and confocal images (F–H) showing strong expression of cabp5b in a subset of cells in the inner ear. Picture in bright field (F), DAPI (G), GFP (H). Scale bar: 20 µm. (I–L) Cross-sections of a retina in the Tg(Vsx2:eGFP) transgenic line. Epifluorescence image of a sectioned retina (I) and magnification (J), showing cabp5b antisense probe signal in the bipolar cell layer. Scale bar: 50 µm. (K–L) Confocal images. GFP signal localized in bipolar cells (K), DAPI (L). Scale bar: 20 µm. Ov: otic vesicle, IE: inner ear, INL: inner nuclear layer. |
| Genes: | |
|---|---|
| Fish: | |
| Anatomical Terms: | |
| Stage Range: | Long-pec to Day 5 |